Free Statistics

of Irreproducible Research!

Author's title

Author*The author of this computation has been verified*
R Software Modulerwasp_histogram.wasp
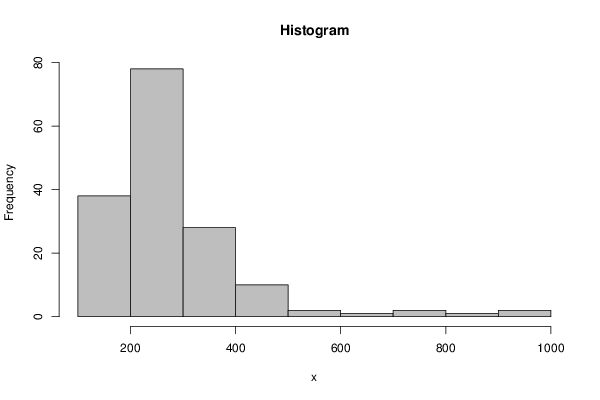
Title produced by softwareHistogram
Date of computationFri, 21 Dec 2012 11:19:33 -0500
Cite this page as followsStatistical Computations at FreeStatistics.org, Office for Research Development and Education, URL https://freestatistics.org/blog/index.php?v=date/2012/Dec/21/t1356106787soj3lrwstwn5oq7.htm/, Retrieved Thu, 25 Apr 2024 06:09:09 +0000
Statistical Computations at FreeStatistics.org, Office for Research Development and Education, URL https://freestatistics.org/blog/index.php?pk=203888, Retrieved Thu, 25 Apr 2024 06:09:09 +0000
QR Codes:

Original text written by user:
IsPrivate?No (this computation is public)
User-defined keywords
Estimated Impact70
Family? (F = Feedback message, R = changed R code, M = changed R Module, P = changed Parameters, D = changed Data)
-     [Maximum-likelihood Fitting - Normal Distribution] [Intrinsic Motivat...] [2010-10-12 11:57:21] [b98453cac15ba1066b407e146608df68]
- R P   [Maximum-likelihood Fitting - Normal Distribution] [Paper-Histogram- ...] [2012-12-15 17:25:05] [8a32126242ff0300e413cfb1e4cb76da]
- RMPD      [Histogram] [] [2012-12-21 16:19:33] [ce0248448cbe5ad845933386ae480935] [Current]
Feedback Forum

Post a new message
Dataseries X:
186.577
244.642
248.18
253.568
171.239
413.945
216.89
227.901
259.813
148.438
240.984
206.248
108.873
267.945
314.171
235.115
203.023
365.415
350.881
263.287
738.743
959.072
483.618
212.996
177.326
352.594
352.594
217.305
236.184
215.701
228.352
485.61
252.492
342.515
196.916
365.292
316.663
313.509
188.12
184.061
362.959
170.16
167.476
211.717
276.453
182.094
266.904
235.312
329.414
258.103
952.5
247.109
498.715
313.298
420.188
231.144
227.828
204.363
216.531
207.167
232.4
203.109
221.044
254.592
108.947
229.416
476.36
221.91
158.944
295.732
187.972
283.753
705.361
178.681
232.612
245.169
186.03
181.116
228.462
491.847
506.455
182.828
263.649
253.703
480.932
209.88
655.852
223.398
103.115
255.657
184.646
372.92
385.655
256.445
204.85
197.38
245.302
301.705
501.463
278.714
205.904
177.14
139.739
366.46
435.511
239.885
178.717
340.015
236.932
221.145
263.271
222.799
317.99
149.589
221.966
201.537
266.885
185.203
347.532
395.593
238.202
254.697
157.584
807.284
249.29
189.194
267.829
173.148
267.618
283.28
209.449
135.104
285.009
178.495
256.848
301.828
158.387
355.961
364.076
233.199
257.619
208.544
212.487
251.035
276.782
198.305
301.018
369.76
162.752
199.946
403.388
364.141
202.375
319.465
185.546
243.559
220.912
193.698
372.928
163.749
217.551
232.519


Summary of computational transaction
Raw Inputview raw input (R code)
Raw Outputview raw output of R engine
Computing time2 seconds
R Server'Sir Ronald Aylmer Fisher' @ fisher.wessa.net

\begin{tabular}{lllllllll}
\hline
Summary of computational transaction \tabularnewline
Raw Input & view raw input (R code)  \tabularnewline
Raw Output & view raw output of R engine  \tabularnewline
Computing time & 2 seconds \tabularnewline
R Server & 'Sir Ronald Aylmer Fisher' @ fisher.wessa.net \tabularnewline
\hline
\end{tabular}
%Source: https://freestatistics.org/blog/index.php?pk=203888&T=0

[TABLE]
[ROW][C]Summary of computational transaction[/C][/ROW]
[ROW][C]Raw Input[/C][C]view raw input (R code) [/C][/ROW]
[ROW][C]Raw Output[/C][C]view raw output of R engine [/C][/ROW]
[ROW][C]Computing time[/C][C]2 seconds[/C][/ROW]
[ROW][C]R Server[/C][C]'Sir Ronald Aylmer Fisher' @ fisher.wessa.net[/C][/ROW]
[/TABLE]
Source: https://freestatistics.org/blog/index.php?pk=203888&T=0

Globally Unique Identifier (entire table): ba.freestatistics.org/blog/index.php?pk=203888&T=0

As an alternative you can also use a QR Code:  

The GUIDs for individual cells are displayed in the table below:

Summary of computational transaction
Raw Inputview raw input (R code)
Raw Outputview raw output of R engine
Computing time2 seconds
R Server'Sir Ronald Aylmer Fisher' @ fisher.wessa.net


Frequency Table (Histogram)
BinsMidpointAbs. FrequencyRel. FrequencyCumul. Rel. Freq.Density
[100,200[150380.2345680.2345680.002346
[200,300[250780.4814810.7160490.004815
[300,400[350280.172840.8888890.001728
[400,500[450100.0617280.9506170.000617
[500,600[55020.0123460.9629630.000123
[600,700[65010.0061730.9691366.2e-05
[700,800[75020.0123460.9814810.000123
[800,900[85010.0061730.9876546.2e-05
[900,1000]95020.01234610.000123

\begin{tabular}{lllllllll}
\hline
Frequency Table (Histogram) \tabularnewline
Bins & Midpoint & Abs. Frequency & Rel. Frequency & Cumul. Rel. Freq. & Density \tabularnewline
[100,200[ & 150 & 38 & 0.234568 & 0.234568 & 0.002346 \tabularnewline
[200,300[ & 250 & 78 & 0.481481 & 0.716049 & 0.004815 \tabularnewline
[300,400[ & 350 & 28 & 0.17284 & 0.888889 & 0.001728 \tabularnewline
[400,500[ & 450 & 10 & 0.061728 & 0.950617 & 0.000617 \tabularnewline
[500,600[ & 550 & 2 & 0.012346 & 0.962963 & 0.000123 \tabularnewline
[600,700[ & 650 & 1 & 0.006173 & 0.969136 & 6.2e-05 \tabularnewline
[700,800[ & 750 & 2 & 0.012346 & 0.981481 & 0.000123 \tabularnewline
[800,900[ & 850 & 1 & 0.006173 & 0.987654 & 6.2e-05 \tabularnewline
[900,1000] & 950 & 2 & 0.012346 & 1 & 0.000123 \tabularnewline
\hline
\end{tabular}
%Source: https://freestatistics.org/blog/index.php?pk=203888&T=1

[TABLE]
[ROW][C]Frequency Table (Histogram)[/C][/ROW]
[ROW][C]Bins[/C][C]Midpoint[/C][C]Abs. Frequency[/C][C]Rel. Frequency[/C][C]Cumul. Rel. Freq.[/C][C]Density[/C][/ROW]
[ROW][C][100,200[[/C][C]150[/C][C]38[/C][C]0.234568[/C][C]0.234568[/C][C]0.002346[/C][/ROW]
[ROW][C][200,300[[/C][C]250[/C][C]78[/C][C]0.481481[/C][C]0.716049[/C][C]0.004815[/C][/ROW]
[ROW][C][300,400[[/C][C]350[/C][C]28[/C][C]0.17284[/C][C]0.888889[/C][C]0.001728[/C][/ROW]
[ROW][C][400,500[[/C][C]450[/C][C]10[/C][C]0.061728[/C][C]0.950617[/C][C]0.000617[/C][/ROW]
[ROW][C][500,600[[/C][C]550[/C][C]2[/C][C]0.012346[/C][C]0.962963[/C][C]0.000123[/C][/ROW]
[ROW][C][600,700[[/C][C]650[/C][C]1[/C][C]0.006173[/C][C]0.969136[/C][C]6.2e-05[/C][/ROW]
[ROW][C][700,800[[/C][C]750[/C][C]2[/C][C]0.012346[/C][C]0.981481[/C][C]0.000123[/C][/ROW]
[ROW][C][800,900[[/C][C]850[/C][C]1[/C][C]0.006173[/C][C]0.987654[/C][C]6.2e-05[/C][/ROW]
[ROW][C][900,1000][/C][C]950[/C][C]2[/C][C]0.012346[/C][C]1[/C][C]0.000123[/C][/ROW]
[/TABLE]
Source: https://freestatistics.org/blog/index.php?pk=203888&T=1

Globally Unique Identifier (entire table): ba.freestatistics.org/blog/index.php?pk=203888&T=1

As an alternative you can also use a QR Code:  

The GUIDs for individual cells are displayed in the table below:

Frequency Table (Histogram)
BinsMidpointAbs. FrequencyRel. FrequencyCumul. Rel. Freq.Density
[100,200[150380.2345680.2345680.002346
[200,300[250780.4814810.7160490.004815
[300,400[350280.172840.8888890.001728
[400,500[450100.0617280.9506170.000617
[500,600[55020.0123460.9629630.000123
[600,700[65010.0061730.9691366.2e-05
[700,800[75020.0123460.9814810.000123
[800,900[85010.0061730.9876546.2e-05
[900,1000]95020.01234610.000123


Parameters (Session):
par2 = grey ; par3 = FALSE ; par4 = Unknown ;
Parameters (R input):
par1 = ; par2 = grey ; par3 = FALSE ; par4 = Unknown ;
R code (references can be found in the software module):
par4 <- 'Unknown'
par3 <- 'FALSE'
par2 <- 'grey'
par1 <- ''
par1 <- as.numeric(par1)
if (par3 == 'TRUE') par3 <- TRUE
if (par3 == 'FALSE') par3 <- FALSE
if (par4 == 'Unknown') par1 <- as.numeric(par1)
if (par4 == 'Interval/Ratio') par1 <- as.numeric(par1)
if (par4 == '3-point Likert') par1 <- c(1:3 - 0.5, 3.5)
if (par4 == '4-point Likert') par1 <- c(1:4 - 0.5, 4.5)
if (par4 == '5-point Likert') par1 <- c(1:5 - 0.5, 5.5)
if (par4 == '6-point Likert') par1 <- c(1:6 - 0.5, 6.5)
if (par4 == '7-point Likert') par1 <- c(1:7 - 0.5, 7.5)
if (par4 == '8-point Likert') par1 <- c(1:8 - 0.5, 8.5)
if (par4 == '9-point Likert') par1 <- c(1:9 - 0.5, 9.5)
if (par4 == '10-point Likert') par1 <- c(1:10 - 0.5, 10.5)
bitmap(file='test1.png')
if(is.numeric(x[1])) {
if (is.na(par1)) {
myhist<-hist(x,col=par2,main=main,xlab=xlab,right=par3)
} else {
if (par1 < 0) par1 <- 3
if (par1 > 50) par1 <- 50
myhist<-hist(x,breaks=par1,col=par2,main=main,xlab=xlab,right=par3)
}
} else {
plot(mytab <- table(x),col=par2,main='Frequency Plot',xlab=xlab,ylab='Absolute Frequency')
}
dev.off()
if(is.numeric(x[1])) {
myhist
n <- length(x)
load(file='createtable')
a<-table.start()
a<-table.row.start(a)
a<-table.element(a,hyperlink('histogram.htm','Frequency Table (Histogram)',''),6,TRUE)
a<-table.row.end(a)
a<-table.row.start(a)
a<-table.element(a,'Bins',header=TRUE)
a<-table.element(a,'Midpoint',header=TRUE)
a<-table.element(a,'Abs. Frequency',header=TRUE)
a<-table.element(a,'Rel. Frequency',header=TRUE)
a<-table.element(a,'Cumul. Rel. Freq.',header=TRUE)
a<-table.element(a,'Density',header=TRUE)
a<-table.row.end(a)
crf <- 0
if (par3 == FALSE) mybracket <- '[' else mybracket <- ']'
mynumrows <- (length(myhist$breaks)-1)
for (i in 1:mynumrows) {
a<-table.row.start(a)
if (i == 1)
dum <- paste('[',myhist$breaks[i],sep='')
else
dum <- paste(mybracket,myhist$breaks[i],sep='')
dum <- paste(dum,myhist$breaks[i+1],sep=',')
if (i==mynumrows)
dum <- paste(dum,']',sep='')
else
dum <- paste(dum,mybracket,sep='')
a<-table.element(a,dum,header=TRUE)
a<-table.element(a,myhist$mids[i])
a<-table.element(a,myhist$counts[i])
rf <- myhist$counts[i]/n
crf <- crf + rf
a<-table.element(a,round(rf,6))
a<-table.element(a,round(crf,6))
a<-table.element(a,round(myhist$density[i],6))
a<-table.row.end(a)
}
a<-table.end(a)
table.save(a,file='mytable.tab')
} else {
mytab
reltab <- mytab / sum(mytab)
n <- length(mytab)
load(file='createtable')
a<-table.start()
a<-table.row.start(a)
a<-table.element(a,'Frequency Table (Categorical Data)',3,TRUE)
a<-table.row.end(a)
a<-table.row.start(a)
a<-table.element(a,'Category',header=TRUE)
a<-table.element(a,'Abs. Frequency',header=TRUE)
a<-table.element(a,'Rel. Frequency',header=TRUE)
a<-table.row.end(a)
for (i in 1:n) {
a<-table.row.start(a)
a<-table.element(a,labels(mytab)$x[i],header=TRUE)
a<-table.element(a,mytab[i])
a<-table.element(a,round(reltab[i],4))
a<-table.row.end(a)
}
a<-table.end(a)
table.save(a,file='mytable1.tab')
}