Free Statistics

of Irreproducible Research!

Author's title

Author*The author of this computation has been verified*
R Software Modulerwasp_autocorrelation.wasp
Title produced by software(Partial) Autocorrelation Function
Date of computationFri, 21 Dec 2012 11:03:13 -0500
Cite this page as followsStatistical Computations at FreeStatistics.org, Office for Research Development and Education, URL https://freestatistics.org/blog/index.php?v=date/2012/Dec/21/t1356105847nm0ttthltgrbqmr.htm/, Retrieved Fri, 26 Apr 2024 14:51:11 +0000
Statistical Computations at FreeStatistics.org, Office for Research Development and Education, URL https://freestatistics.org/blog/index.php?pk=203865, Retrieved Fri, 26 Apr 2024 14:51:11 +0000
QR Codes:

Original text written by user:
IsPrivate?No (this computation is public)
User-defined keywords
Estimated Impact107
Family? (F = Feedback message, R = changed R code, M = changed R Module, P = changed Parameters, D = changed Data)
-     [Multiple Regression] [HPC Retail Sales] [2008-03-08 13:40:54] [1c0f2c85e8a48e42648374b3bcceca26]
- RMPD  [Multiple Regression] [forecast] [2012-11-24 21:49:17] [0883bf8f4217d775edf6393676d58a73]
- R  D    [Multiple Regression] [] [2012-12-21 11:22:02] [0604709baf8ca89a71bc0fcadc3cdffd]
- RMP       [(Partial) Autocorrelation Function] [] [2012-12-21 15:18:29] [0604709baf8ca89a71bc0fcadc3cdffd]
- R             [(Partial) Autocorrelation Function] [] [2012-12-21 16:03:13] [b650a28572edc4a1d205c228043a3295] [Current]
Feedback Forum

Post a new message
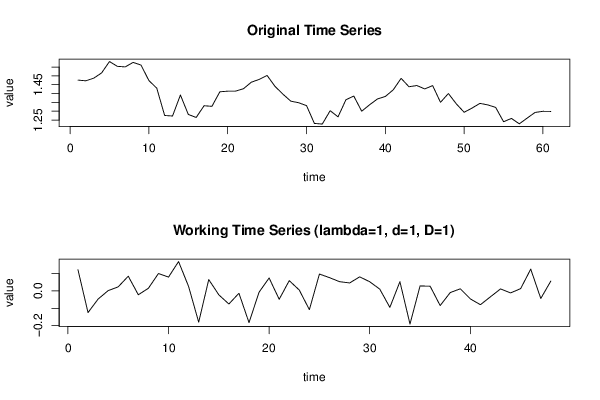
Dataseries X:
1.4761
1.4721
1.487
1.5167
1.5812
1.554
1.5508
1.5764
1.5611
1.4735
1.4303
1.2757
1.2727
1.3917
1.2816
1.2644
1.3308
1.3275
1.4098
1.4134
1.4138
1.4272
1.4643
1.48
1.5023
1.4406
1.3966
1.357
1.3479
1.3315
1.2307
1.2271
1.3028
1.268
1.3648
1.3857
1.2998
1.3362
1.3692
1.3834
1.4207
1.486
1.4385
1.4453
1.426
1.445
1.3503
1.4001
1.3418
1.2939
1.3176
1.3443
1.3356
1.3214
1.2403
1.259
1.2284
1.2611
1.293
1.2993
1.2986


Summary of computational transaction
Raw Inputview raw input (R code)
Raw Outputview raw output of R engine
Computing time3 seconds
R Server'George Udny Yule' @ yule.wessa.net

\begin{tabular}{lllllllll}
\hline
Summary of computational transaction \tabularnewline
Raw Input & view raw input (R code)  \tabularnewline
Raw Output & view raw output of R engine  \tabularnewline
Computing time & 3 seconds \tabularnewline
R Server & 'George Udny Yule' @ yule.wessa.net \tabularnewline
\hline
\end{tabular}
%Source: https://freestatistics.org/blog/index.php?pk=203865&T=0

[TABLE]
[ROW][C]Summary of computational transaction[/C][/ROW]
[ROW][C]Raw Input[/C][C]view raw input (R code) [/C][/ROW]
[ROW][C]Raw Output[/C][C]view raw output of R engine [/C][/ROW]
[ROW][C]Computing time[/C][C]3 seconds[/C][/ROW]
[ROW][C]R Server[/C][C]'George Udny Yule' @ yule.wessa.net[/C][/ROW]
[/TABLE]
Source: https://freestatistics.org/blog/index.php?pk=203865&T=0

Globally Unique Identifier (entire table): ba.freestatistics.org/blog/index.php?pk=203865&T=0

As an alternative you can also use a QR Code:  

The GUIDs for individual cells are displayed in the table below:

Summary of computational transaction
Raw Inputview raw input (R code)
Raw Outputview raw output of R engine
Computing time3 seconds
R Server'George Udny Yule' @ yule.wessa.net


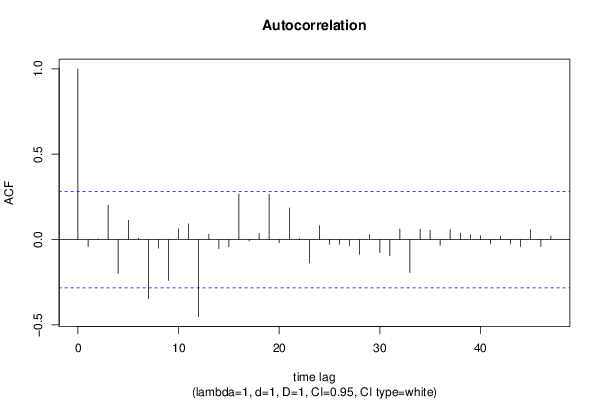
Autocorrelation Function
Time lag kACF(k)T-STATP-value
1-0.041215-0.28550.388229
20.0029990.02080.491754
30.2009081.39190.085179
4-0.197692-1.36970.088585
50.112270.77780.220244
60.0072790.05040.479994
7-0.347032-2.40430.010056
8-0.050227-0.3480.364687
9-0.240479-1.66610.051105
100.0629670.43620.332307
110.0920470.63770.263344
12-0.452098-3.13220.001477
130.0308690.21390.415779
14-0.053137-0.36810.357193
15-0.042291-0.2930.385393
160.2672511.85160.035122
17-0.008705-0.06030.47608
180.0352130.2440.40415
190.2643511.83150.03662
20-0.018352-0.12710.449677
210.1845991.27890.103534
220.0066610.04610.481691
23-0.13696-0.94890.173715
240.0805980.55840.289585
25-0.02749-0.19050.424879
26-0.027988-0.19390.423534
27-0.036959-0.25610.399499
28-0.086573-0.59980.275732
290.0286330.19840.421794
30-0.076892-0.53270.298341
31-0.094454-0.65440.257989
320.0618820.42870.335018
33-0.192932-1.33670.093816
340.0597350.41390.340412
350.0552050.38250.3519
36-0.034312-0.23770.406556
370.0582030.40320.34428
380.037440.25940.398221
390.0284340.1970.42233
400.0215810.14950.440886
41-0.024419-0.16920.433184
420.0185920.12880.449023
43-0.026388-0.18280.427855
44-0.04013-0.2780.391093
450.058820.40750.34272
46-0.040992-0.2840.388816
470.0211770.14670.441984
48NANANA
49NANANA
50NANANA
51NANANA
52NANANA
53NANANA
54NANANA
55NANANA
56NANANA
57NANANA
58NANANA
59NANANA
60NANANA

\begin{tabular}{lllllllll}
\hline
Autocorrelation Function \tabularnewline
Time lag k & ACF(k) & T-STAT & P-value \tabularnewline
1 & -0.041215 & -0.2855 & 0.388229 \tabularnewline
2 & 0.002999 & 0.0208 & 0.491754 \tabularnewline
3 & 0.200908 & 1.3919 & 0.085179 \tabularnewline
4 & -0.197692 & -1.3697 & 0.088585 \tabularnewline
5 & 0.11227 & 0.7778 & 0.220244 \tabularnewline
6 & 0.007279 & 0.0504 & 0.479994 \tabularnewline
7 & -0.347032 & -2.4043 & 0.010056 \tabularnewline
8 & -0.050227 & -0.348 & 0.364687 \tabularnewline
9 & -0.240479 & -1.6661 & 0.051105 \tabularnewline
10 & 0.062967 & 0.4362 & 0.332307 \tabularnewline
11 & 0.092047 & 0.6377 & 0.263344 \tabularnewline
12 & -0.452098 & -3.1322 & 0.001477 \tabularnewline
13 & 0.030869 & 0.2139 & 0.415779 \tabularnewline
14 & -0.053137 & -0.3681 & 0.357193 \tabularnewline
15 & -0.042291 & -0.293 & 0.385393 \tabularnewline
16 & 0.267251 & 1.8516 & 0.035122 \tabularnewline
17 & -0.008705 & -0.0603 & 0.47608 \tabularnewline
18 & 0.035213 & 0.244 & 0.40415 \tabularnewline
19 & 0.264351 & 1.8315 & 0.03662 \tabularnewline
20 & -0.018352 & -0.1271 & 0.449677 \tabularnewline
21 & 0.184599 & 1.2789 & 0.103534 \tabularnewline
22 & 0.006661 & 0.0461 & 0.481691 \tabularnewline
23 & -0.13696 & -0.9489 & 0.173715 \tabularnewline
24 & 0.080598 & 0.5584 & 0.289585 \tabularnewline
25 & -0.02749 & -0.1905 & 0.424879 \tabularnewline
26 & -0.027988 & -0.1939 & 0.423534 \tabularnewline
27 & -0.036959 & -0.2561 & 0.399499 \tabularnewline
28 & -0.086573 & -0.5998 & 0.275732 \tabularnewline
29 & 0.028633 & 0.1984 & 0.421794 \tabularnewline
30 & -0.076892 & -0.5327 & 0.298341 \tabularnewline
31 & -0.094454 & -0.6544 & 0.257989 \tabularnewline
32 & 0.061882 & 0.4287 & 0.335018 \tabularnewline
33 & -0.192932 & -1.3367 & 0.093816 \tabularnewline
34 & 0.059735 & 0.4139 & 0.340412 \tabularnewline
35 & 0.055205 & 0.3825 & 0.3519 \tabularnewline
36 & -0.034312 & -0.2377 & 0.406556 \tabularnewline
37 & 0.058203 & 0.4032 & 0.34428 \tabularnewline
38 & 0.03744 & 0.2594 & 0.398221 \tabularnewline
39 & 0.028434 & 0.197 & 0.42233 \tabularnewline
40 & 0.021581 & 0.1495 & 0.440886 \tabularnewline
41 & -0.024419 & -0.1692 & 0.433184 \tabularnewline
42 & 0.018592 & 0.1288 & 0.449023 \tabularnewline
43 & -0.026388 & -0.1828 & 0.427855 \tabularnewline
44 & -0.04013 & -0.278 & 0.391093 \tabularnewline
45 & 0.05882 & 0.4075 & 0.34272 \tabularnewline
46 & -0.040992 & -0.284 & 0.388816 \tabularnewline
47 & 0.021177 & 0.1467 & 0.441984 \tabularnewline
48 & NA & NA & NA \tabularnewline
49 & NA & NA & NA \tabularnewline
50 & NA & NA & NA \tabularnewline
51 & NA & NA & NA \tabularnewline
52 & NA & NA & NA \tabularnewline
53 & NA & NA & NA \tabularnewline
54 & NA & NA & NA \tabularnewline
55 & NA & NA & NA \tabularnewline
56 & NA & NA & NA \tabularnewline
57 & NA & NA & NA \tabularnewline
58 & NA & NA & NA \tabularnewline
59 & NA & NA & NA \tabularnewline
60 & NA & NA & NA \tabularnewline
\hline
\end{tabular}
%Source: https://freestatistics.org/blog/index.php?pk=203865&T=1

[TABLE]
[ROW][C]Autocorrelation Function[/C][/ROW]
[ROW][C]Time lag k[/C][C]ACF(k)[/C][C]T-STAT[/C][C]P-value[/C][/ROW]
[ROW][C]1[/C][C]-0.041215[/C][C]-0.2855[/C][C]0.388229[/C][/ROW]
[ROW][C]2[/C][C]0.002999[/C][C]0.0208[/C][C]0.491754[/C][/ROW]
[ROW][C]3[/C][C]0.200908[/C][C]1.3919[/C][C]0.085179[/C][/ROW]
[ROW][C]4[/C][C]-0.197692[/C][C]-1.3697[/C][C]0.088585[/C][/ROW]
[ROW][C]5[/C][C]0.11227[/C][C]0.7778[/C][C]0.220244[/C][/ROW]
[ROW][C]6[/C][C]0.007279[/C][C]0.0504[/C][C]0.479994[/C][/ROW]
[ROW][C]7[/C][C]-0.347032[/C][C]-2.4043[/C][C]0.010056[/C][/ROW]
[ROW][C]8[/C][C]-0.050227[/C][C]-0.348[/C][C]0.364687[/C][/ROW]
[ROW][C]9[/C][C]-0.240479[/C][C]-1.6661[/C][C]0.051105[/C][/ROW]
[ROW][C]10[/C][C]0.062967[/C][C]0.4362[/C][C]0.332307[/C][/ROW]
[ROW][C]11[/C][C]0.092047[/C][C]0.6377[/C][C]0.263344[/C][/ROW]
[ROW][C]12[/C][C]-0.452098[/C][C]-3.1322[/C][C]0.001477[/C][/ROW]
[ROW][C]13[/C][C]0.030869[/C][C]0.2139[/C][C]0.415779[/C][/ROW]
[ROW][C]14[/C][C]-0.053137[/C][C]-0.3681[/C][C]0.357193[/C][/ROW]
[ROW][C]15[/C][C]-0.042291[/C][C]-0.293[/C][C]0.385393[/C][/ROW]
[ROW][C]16[/C][C]0.267251[/C][C]1.8516[/C][C]0.035122[/C][/ROW]
[ROW][C]17[/C][C]-0.008705[/C][C]-0.0603[/C][C]0.47608[/C][/ROW]
[ROW][C]18[/C][C]0.035213[/C][C]0.244[/C][C]0.40415[/C][/ROW]
[ROW][C]19[/C][C]0.264351[/C][C]1.8315[/C][C]0.03662[/C][/ROW]
[ROW][C]20[/C][C]-0.018352[/C][C]-0.1271[/C][C]0.449677[/C][/ROW]
[ROW][C]21[/C][C]0.184599[/C][C]1.2789[/C][C]0.103534[/C][/ROW]
[ROW][C]22[/C][C]0.006661[/C][C]0.0461[/C][C]0.481691[/C][/ROW]
[ROW][C]23[/C][C]-0.13696[/C][C]-0.9489[/C][C]0.173715[/C][/ROW]
[ROW][C]24[/C][C]0.080598[/C][C]0.5584[/C][C]0.289585[/C][/ROW]
[ROW][C]25[/C][C]-0.02749[/C][C]-0.1905[/C][C]0.424879[/C][/ROW]
[ROW][C]26[/C][C]-0.027988[/C][C]-0.1939[/C][C]0.423534[/C][/ROW]
[ROW][C]27[/C][C]-0.036959[/C][C]-0.2561[/C][C]0.399499[/C][/ROW]
[ROW][C]28[/C][C]-0.086573[/C][C]-0.5998[/C][C]0.275732[/C][/ROW]
[ROW][C]29[/C][C]0.028633[/C][C]0.1984[/C][C]0.421794[/C][/ROW]
[ROW][C]30[/C][C]-0.076892[/C][C]-0.5327[/C][C]0.298341[/C][/ROW]
[ROW][C]31[/C][C]-0.094454[/C][C]-0.6544[/C][C]0.257989[/C][/ROW]
[ROW][C]32[/C][C]0.061882[/C][C]0.4287[/C][C]0.335018[/C][/ROW]
[ROW][C]33[/C][C]-0.192932[/C][C]-1.3367[/C][C]0.093816[/C][/ROW]
[ROW][C]34[/C][C]0.059735[/C][C]0.4139[/C][C]0.340412[/C][/ROW]
[ROW][C]35[/C][C]0.055205[/C][C]0.3825[/C][C]0.3519[/C][/ROW]
[ROW][C]36[/C][C]-0.034312[/C][C]-0.2377[/C][C]0.406556[/C][/ROW]
[ROW][C]37[/C][C]0.058203[/C][C]0.4032[/C][C]0.34428[/C][/ROW]
[ROW][C]38[/C][C]0.03744[/C][C]0.2594[/C][C]0.398221[/C][/ROW]
[ROW][C]39[/C][C]0.028434[/C][C]0.197[/C][C]0.42233[/C][/ROW]
[ROW][C]40[/C][C]0.021581[/C][C]0.1495[/C][C]0.440886[/C][/ROW]
[ROW][C]41[/C][C]-0.024419[/C][C]-0.1692[/C][C]0.433184[/C][/ROW]
[ROW][C]42[/C][C]0.018592[/C][C]0.1288[/C][C]0.449023[/C][/ROW]
[ROW][C]43[/C][C]-0.026388[/C][C]-0.1828[/C][C]0.427855[/C][/ROW]
[ROW][C]44[/C][C]-0.04013[/C][C]-0.278[/C][C]0.391093[/C][/ROW]
[ROW][C]45[/C][C]0.05882[/C][C]0.4075[/C][C]0.34272[/C][/ROW]
[ROW][C]46[/C][C]-0.040992[/C][C]-0.284[/C][C]0.388816[/C][/ROW]
[ROW][C]47[/C][C]0.021177[/C][C]0.1467[/C][C]0.441984[/C][/ROW]
[ROW][C]48[/C][C]NA[/C][C]NA[/C][C]NA[/C][/ROW]
[ROW][C]49[/C][C]NA[/C][C]NA[/C][C]NA[/C][/ROW]
[ROW][C]50[/C][C]NA[/C][C]NA[/C][C]NA[/C][/ROW]
[ROW][C]51[/C][C]NA[/C][C]NA[/C][C]NA[/C][/ROW]
[ROW][C]52[/C][C]NA[/C][C]NA[/C][C]NA[/C][/ROW]
[ROW][C]53[/C][C]NA[/C][C]NA[/C][C]NA[/C][/ROW]
[ROW][C]54[/C][C]NA[/C][C]NA[/C][C]NA[/C][/ROW]
[ROW][C]55[/C][C]NA[/C][C]NA[/C][C]NA[/C][/ROW]
[ROW][C]56[/C][C]NA[/C][C]NA[/C][C]NA[/C][/ROW]
[ROW][C]57[/C][C]NA[/C][C]NA[/C][C]NA[/C][/ROW]
[ROW][C]58[/C][C]NA[/C][C]NA[/C][C]NA[/C][/ROW]
[ROW][C]59[/C][C]NA[/C][C]NA[/C][C]NA[/C][/ROW]
[ROW][C]60[/C][C]NA[/C][C]NA[/C][C]NA[/C][/ROW]
[/TABLE]
Source: https://freestatistics.org/blog/index.php?pk=203865&T=1

Globally Unique Identifier (entire table): ba.freestatistics.org/blog/index.php?pk=203865&T=1

As an alternative you can also use a QR Code:  

The GUIDs for individual cells are displayed in the table below:

Autocorrelation Function
Time lag kACF(k)T-STATP-value
1-0.041215-0.28550.388229
20.0029990.02080.491754
30.2009081.39190.085179
4-0.197692-1.36970.088585
50.112270.77780.220244
60.0072790.05040.479994
7-0.347032-2.40430.010056
8-0.050227-0.3480.364687
9-0.240479-1.66610.051105
100.0629670.43620.332307
110.0920470.63770.263344
12-0.452098-3.13220.001477
130.0308690.21390.415779
14-0.053137-0.36810.357193
15-0.042291-0.2930.385393
160.2672511.85160.035122
17-0.008705-0.06030.47608
180.0352130.2440.40415
190.2643511.83150.03662
20-0.018352-0.12710.449677
210.1845991.27890.103534
220.0066610.04610.481691
23-0.13696-0.94890.173715
240.0805980.55840.289585
25-0.02749-0.19050.424879
26-0.027988-0.19390.423534
27-0.036959-0.25610.399499
28-0.086573-0.59980.275732
290.0286330.19840.421794
30-0.076892-0.53270.298341
31-0.094454-0.65440.257989
320.0618820.42870.335018
33-0.192932-1.33670.093816
340.0597350.41390.340412
350.0552050.38250.3519
36-0.034312-0.23770.406556
370.0582030.40320.34428
380.037440.25940.398221
390.0284340.1970.42233
400.0215810.14950.440886
41-0.024419-0.16920.433184
420.0185920.12880.449023
43-0.026388-0.18280.427855
44-0.04013-0.2780.391093
450.058820.40750.34272
46-0.040992-0.2840.388816
470.0211770.14670.441984
48NANANA
49NANANA
50NANANA
51NANANA
52NANANA
53NANANA
54NANANA
55NANANA
56NANANA
57NANANA
58NANANA
59NANANA
60NANANA


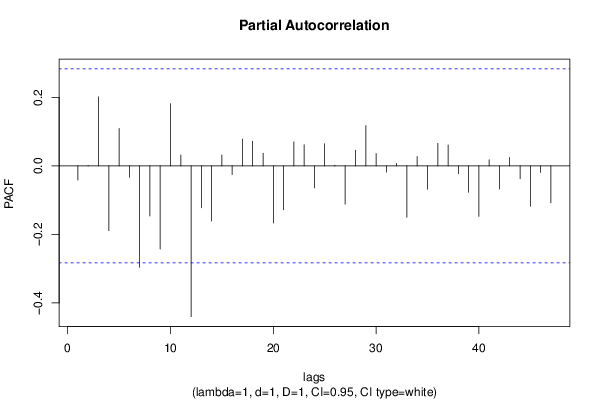
Partial Autocorrelation Function
Time lag kPACF(k)T-STATP-value
1-0.041215-0.28550.388229
20.0013030.0090.496418
30.2014281.39550.084639
4-0.189077-1.310.098222
50.10930.75730.2263
6-0.03306-0.2290.409903
7-0.296009-2.05080.022883
8-0.14608-1.01210.15829
9-0.24257-1.68060.049672
100.1816061.25820.107202
110.0320150.22180.412702
12-0.439998-3.04840.001868
13-0.122144-0.84620.20081
14-0.160644-1.1130.135632
150.0317530.220.413406
16-0.025011-0.17330.43158
170.0786480.54490.294176
180.072060.49920.309944
190.037090.2570.399152
20-0.166522-1.15370.127168
21-0.127956-0.88650.189884
220.0701750.48620.314524
230.0617770.4280.335282
24-0.064145-0.44440.329373
250.0645440.44720.328379
260.001740.01210.495215
27-0.111728-0.77410.221341
280.0457030.31660.376445
290.1175220.81420.209772
300.0358440.24830.402468
31-0.018133-0.12560.450276
320.0072890.05050.479966
33-0.150069-1.03970.151842
340.0276080.19130.42456
35-0.068366-0.47370.318947
360.0658170.4560.325226
370.0609830.42250.337273
38-0.023027-0.15950.436958
39-0.077156-0.53450.297714
40-0.147471-1.02170.15602
410.0178750.12380.450979
42-0.067353-0.46660.321436
430.0243640.16880.433333
44-0.037619-0.26060.397746
45-0.118032-0.81770.208771
46-0.019225-0.13320.447299
47-0.10787-0.74730.229251
48NANANA
49NANANA
50NANANA
51NANANA
52NANANA
53NANANA
54NANANA
55NANANA
56NANANA
57NANANA
58NANANA
59NANANA
60NANANA

\begin{tabular}{lllllllll}
\hline
Partial Autocorrelation Function \tabularnewline
Time lag k & PACF(k) & T-STAT & P-value \tabularnewline
1 & -0.041215 & -0.2855 & 0.388229 \tabularnewline
2 & 0.001303 & 0.009 & 0.496418 \tabularnewline
3 & 0.201428 & 1.3955 & 0.084639 \tabularnewline
4 & -0.189077 & -1.31 & 0.098222 \tabularnewline
5 & 0.1093 & 0.7573 & 0.2263 \tabularnewline
6 & -0.03306 & -0.229 & 0.409903 \tabularnewline
7 & -0.296009 & -2.0508 & 0.022883 \tabularnewline
8 & -0.14608 & -1.0121 & 0.15829 \tabularnewline
9 & -0.24257 & -1.6806 & 0.049672 \tabularnewline
10 & 0.181606 & 1.2582 & 0.107202 \tabularnewline
11 & 0.032015 & 0.2218 & 0.412702 \tabularnewline
12 & -0.439998 & -3.0484 & 0.001868 \tabularnewline
13 & -0.122144 & -0.8462 & 0.20081 \tabularnewline
14 & -0.160644 & -1.113 & 0.135632 \tabularnewline
15 & 0.031753 & 0.22 & 0.413406 \tabularnewline
16 & -0.025011 & -0.1733 & 0.43158 \tabularnewline
17 & 0.078648 & 0.5449 & 0.294176 \tabularnewline
18 & 0.07206 & 0.4992 & 0.309944 \tabularnewline
19 & 0.03709 & 0.257 & 0.399152 \tabularnewline
20 & -0.166522 & -1.1537 & 0.127168 \tabularnewline
21 & -0.127956 & -0.8865 & 0.189884 \tabularnewline
22 & 0.070175 & 0.4862 & 0.314524 \tabularnewline
23 & 0.061777 & 0.428 & 0.335282 \tabularnewline
24 & -0.064145 & -0.4444 & 0.329373 \tabularnewline
25 & 0.064544 & 0.4472 & 0.328379 \tabularnewline
26 & 0.00174 & 0.0121 & 0.495215 \tabularnewline
27 & -0.111728 & -0.7741 & 0.221341 \tabularnewline
28 & 0.045703 & 0.3166 & 0.376445 \tabularnewline
29 & 0.117522 & 0.8142 & 0.209772 \tabularnewline
30 & 0.035844 & 0.2483 & 0.402468 \tabularnewline
31 & -0.018133 & -0.1256 & 0.450276 \tabularnewline
32 & 0.007289 & 0.0505 & 0.479966 \tabularnewline
33 & -0.150069 & -1.0397 & 0.151842 \tabularnewline
34 & 0.027608 & 0.1913 & 0.42456 \tabularnewline
35 & -0.068366 & -0.4737 & 0.318947 \tabularnewline
36 & 0.065817 & 0.456 & 0.325226 \tabularnewline
37 & 0.060983 & 0.4225 & 0.337273 \tabularnewline
38 & -0.023027 & -0.1595 & 0.436958 \tabularnewline
39 & -0.077156 & -0.5345 & 0.297714 \tabularnewline
40 & -0.147471 & -1.0217 & 0.15602 \tabularnewline
41 & 0.017875 & 0.1238 & 0.450979 \tabularnewline
42 & -0.067353 & -0.4666 & 0.321436 \tabularnewline
43 & 0.024364 & 0.1688 & 0.433333 \tabularnewline
44 & -0.037619 & -0.2606 & 0.397746 \tabularnewline
45 & -0.118032 & -0.8177 & 0.208771 \tabularnewline
46 & -0.019225 & -0.1332 & 0.447299 \tabularnewline
47 & -0.10787 & -0.7473 & 0.229251 \tabularnewline
48 & NA & NA & NA \tabularnewline
49 & NA & NA & NA \tabularnewline
50 & NA & NA & NA \tabularnewline
51 & NA & NA & NA \tabularnewline
52 & NA & NA & NA \tabularnewline
53 & NA & NA & NA \tabularnewline
54 & NA & NA & NA \tabularnewline
55 & NA & NA & NA \tabularnewline
56 & NA & NA & NA \tabularnewline
57 & NA & NA & NA \tabularnewline
58 & NA & NA & NA \tabularnewline
59 & NA & NA & NA \tabularnewline
60 & NA & NA & NA \tabularnewline
\hline
\end{tabular}
%Source: https://freestatistics.org/blog/index.php?pk=203865&T=2

[TABLE]
[ROW][C]Partial Autocorrelation Function[/C][/ROW]
[ROW][C]Time lag k[/C][C]PACF(k)[/C][C]T-STAT[/C][C]P-value[/C][/ROW]
[ROW][C]1[/C][C]-0.041215[/C][C]-0.2855[/C][C]0.388229[/C][/ROW]
[ROW][C]2[/C][C]0.001303[/C][C]0.009[/C][C]0.496418[/C][/ROW]
[ROW][C]3[/C][C]0.201428[/C][C]1.3955[/C][C]0.084639[/C][/ROW]
[ROW][C]4[/C][C]-0.189077[/C][C]-1.31[/C][C]0.098222[/C][/ROW]
[ROW][C]5[/C][C]0.1093[/C][C]0.7573[/C][C]0.2263[/C][/ROW]
[ROW][C]6[/C][C]-0.03306[/C][C]-0.229[/C][C]0.409903[/C][/ROW]
[ROW][C]7[/C][C]-0.296009[/C][C]-2.0508[/C][C]0.022883[/C][/ROW]
[ROW][C]8[/C][C]-0.14608[/C][C]-1.0121[/C][C]0.15829[/C][/ROW]
[ROW][C]9[/C][C]-0.24257[/C][C]-1.6806[/C][C]0.049672[/C][/ROW]
[ROW][C]10[/C][C]0.181606[/C][C]1.2582[/C][C]0.107202[/C][/ROW]
[ROW][C]11[/C][C]0.032015[/C][C]0.2218[/C][C]0.412702[/C][/ROW]
[ROW][C]12[/C][C]-0.439998[/C][C]-3.0484[/C][C]0.001868[/C][/ROW]
[ROW][C]13[/C][C]-0.122144[/C][C]-0.8462[/C][C]0.20081[/C][/ROW]
[ROW][C]14[/C][C]-0.160644[/C][C]-1.113[/C][C]0.135632[/C][/ROW]
[ROW][C]15[/C][C]0.031753[/C][C]0.22[/C][C]0.413406[/C][/ROW]
[ROW][C]16[/C][C]-0.025011[/C][C]-0.1733[/C][C]0.43158[/C][/ROW]
[ROW][C]17[/C][C]0.078648[/C][C]0.5449[/C][C]0.294176[/C][/ROW]
[ROW][C]18[/C][C]0.07206[/C][C]0.4992[/C][C]0.309944[/C][/ROW]
[ROW][C]19[/C][C]0.03709[/C][C]0.257[/C][C]0.399152[/C][/ROW]
[ROW][C]20[/C][C]-0.166522[/C][C]-1.1537[/C][C]0.127168[/C][/ROW]
[ROW][C]21[/C][C]-0.127956[/C][C]-0.8865[/C][C]0.189884[/C][/ROW]
[ROW][C]22[/C][C]0.070175[/C][C]0.4862[/C][C]0.314524[/C][/ROW]
[ROW][C]23[/C][C]0.061777[/C][C]0.428[/C][C]0.335282[/C][/ROW]
[ROW][C]24[/C][C]-0.064145[/C][C]-0.4444[/C][C]0.329373[/C][/ROW]
[ROW][C]25[/C][C]0.064544[/C][C]0.4472[/C][C]0.328379[/C][/ROW]
[ROW][C]26[/C][C]0.00174[/C][C]0.0121[/C][C]0.495215[/C][/ROW]
[ROW][C]27[/C][C]-0.111728[/C][C]-0.7741[/C][C]0.221341[/C][/ROW]
[ROW][C]28[/C][C]0.045703[/C][C]0.3166[/C][C]0.376445[/C][/ROW]
[ROW][C]29[/C][C]0.117522[/C][C]0.8142[/C][C]0.209772[/C][/ROW]
[ROW][C]30[/C][C]0.035844[/C][C]0.2483[/C][C]0.402468[/C][/ROW]
[ROW][C]31[/C][C]-0.018133[/C][C]-0.1256[/C][C]0.450276[/C][/ROW]
[ROW][C]32[/C][C]0.007289[/C][C]0.0505[/C][C]0.479966[/C][/ROW]
[ROW][C]33[/C][C]-0.150069[/C][C]-1.0397[/C][C]0.151842[/C][/ROW]
[ROW][C]34[/C][C]0.027608[/C][C]0.1913[/C][C]0.42456[/C][/ROW]
[ROW][C]35[/C][C]-0.068366[/C][C]-0.4737[/C][C]0.318947[/C][/ROW]
[ROW][C]36[/C][C]0.065817[/C][C]0.456[/C][C]0.325226[/C][/ROW]
[ROW][C]37[/C][C]0.060983[/C][C]0.4225[/C][C]0.337273[/C][/ROW]
[ROW][C]38[/C][C]-0.023027[/C][C]-0.1595[/C][C]0.436958[/C][/ROW]
[ROW][C]39[/C][C]-0.077156[/C][C]-0.5345[/C][C]0.297714[/C][/ROW]
[ROW][C]40[/C][C]-0.147471[/C][C]-1.0217[/C][C]0.15602[/C][/ROW]
[ROW][C]41[/C][C]0.017875[/C][C]0.1238[/C][C]0.450979[/C][/ROW]
[ROW][C]42[/C][C]-0.067353[/C][C]-0.4666[/C][C]0.321436[/C][/ROW]
[ROW][C]43[/C][C]0.024364[/C][C]0.1688[/C][C]0.433333[/C][/ROW]
[ROW][C]44[/C][C]-0.037619[/C][C]-0.2606[/C][C]0.397746[/C][/ROW]
[ROW][C]45[/C][C]-0.118032[/C][C]-0.8177[/C][C]0.208771[/C][/ROW]
[ROW][C]46[/C][C]-0.019225[/C][C]-0.1332[/C][C]0.447299[/C][/ROW]
[ROW][C]47[/C][C]-0.10787[/C][C]-0.7473[/C][C]0.229251[/C][/ROW]
[ROW][C]48[/C][C]NA[/C][C]NA[/C][C]NA[/C][/ROW]
[ROW][C]49[/C][C]NA[/C][C]NA[/C][C]NA[/C][/ROW]
[ROW][C]50[/C][C]NA[/C][C]NA[/C][C]NA[/C][/ROW]
[ROW][C]51[/C][C]NA[/C][C]NA[/C][C]NA[/C][/ROW]
[ROW][C]52[/C][C]NA[/C][C]NA[/C][C]NA[/C][/ROW]
[ROW][C]53[/C][C]NA[/C][C]NA[/C][C]NA[/C][/ROW]
[ROW][C]54[/C][C]NA[/C][C]NA[/C][C]NA[/C][/ROW]
[ROW][C]55[/C][C]NA[/C][C]NA[/C][C]NA[/C][/ROW]
[ROW][C]56[/C][C]NA[/C][C]NA[/C][C]NA[/C][/ROW]
[ROW][C]57[/C][C]NA[/C][C]NA[/C][C]NA[/C][/ROW]
[ROW][C]58[/C][C]NA[/C][C]NA[/C][C]NA[/C][/ROW]
[ROW][C]59[/C][C]NA[/C][C]NA[/C][C]NA[/C][/ROW]
[ROW][C]60[/C][C]NA[/C][C]NA[/C][C]NA[/C][/ROW]
[/TABLE]
Source: https://freestatistics.org/blog/index.php?pk=203865&T=2

Globally Unique Identifier (entire table): ba.freestatistics.org/blog/index.php?pk=203865&T=2

As an alternative you can also use a QR Code:  

The GUIDs for individual cells are displayed in the table below:

Partial Autocorrelation Function
Time lag kPACF(k)T-STATP-value
1-0.041215-0.28550.388229
20.0013030.0090.496418
30.2014281.39550.084639
4-0.189077-1.310.098222
50.10930.75730.2263
6-0.03306-0.2290.409903
7-0.296009-2.05080.022883
8-0.14608-1.01210.15829
9-0.24257-1.68060.049672
100.1816061.25820.107202
110.0320150.22180.412702
12-0.439998-3.04840.001868
13-0.122144-0.84620.20081
14-0.160644-1.1130.135632
150.0317530.220.413406
16-0.025011-0.17330.43158
170.0786480.54490.294176
180.072060.49920.309944
190.037090.2570.399152
20-0.166522-1.15370.127168
21-0.127956-0.88650.189884
220.0701750.48620.314524
230.0617770.4280.335282
24-0.064145-0.44440.329373
250.0645440.44720.328379
260.001740.01210.495215
27-0.111728-0.77410.221341
280.0457030.31660.376445
290.1175220.81420.209772
300.0358440.24830.402468
31-0.018133-0.12560.450276
320.0072890.05050.479966
33-0.150069-1.03970.151842
340.0276080.19130.42456
35-0.068366-0.47370.318947
360.0658170.4560.325226
370.0609830.42250.337273
38-0.023027-0.15950.436958
39-0.077156-0.53450.297714
40-0.147471-1.02170.15602
410.0178750.12380.450979
42-0.067353-0.46660.321436
430.0243640.16880.433333
44-0.037619-0.26060.397746
45-0.118032-0.81770.208771
46-0.019225-0.13320.447299
47-0.10787-0.74730.229251
48NANANA
49NANANA
50NANANA
51NANANA
52NANANA
53NANANA
54NANANA
55NANANA
56NANANA
57NANANA
58NANANA
59NANANA
60NANANA


Parameters (Session):
par2 = grey ; par3 = FALSE ; par4 = Unknown ;
Parameters (R input):
par1 = 60 ; par2 = 1 ; par3 = 1 ; par4 = 1 ; par5 = 12 ; par6 = White Noise ; par7 = 0.95 ; par8 = ;
R code (references can be found in the software module):
if (par1 == 'Default') {
par1 = 10*log10(length(x))
} else {
par1 <- as.numeric(par1)
}
par2 <- as.numeric(par2)
par3 <- as.numeric(par3)
par4 <- as.numeric(par4)
par5 <- as.numeric(par5)
if (par6 == 'White Noise') par6 <- 'white' else par6 <- 'ma'
par7 <- as.numeric(par7)
if (par8 != '') par8 <- as.numeric(par8)
ox <- x
if (par8 == '') {
if (par2 == 0) {
x <- log(x)
} else {
x <- (x ^ par2 - 1) / par2
}
} else {
x <- log(x,base=par8)
}
if (par3 > 0) x <- diff(x,lag=1,difference=par3)
if (par4 > 0) x <- diff(x,lag=par5,difference=par4)
bitmap(file='picts.png')
op <- par(mfrow=c(2,1))
plot(ox,type='l',main='Original Time Series',xlab='time',ylab='value')
if (par8=='') {
mytitle <- paste('Working Time Series (lambda=',par2,', d=',par3,', D=',par4,')',sep='')
mysub <- paste('(lambda=',par2,', d=',par3,', D=',par4,', CI=', par7, ', CI type=',par6,')',sep='')
} else {
mytitle <- paste('Working Time Series (base=',par8,', d=',par3,', D=',par4,')',sep='')
mysub <- paste('(base=',par8,', d=',par3,', D=',par4,', CI=', par7, ', CI type=',par6,')',sep='')
}
plot(x,type='l', main=mytitle,xlab='time',ylab='value')
par(op)
dev.off()
bitmap(file='pic1.png')
racf <- acf(x, par1, main='Autocorrelation', xlab='time lag', ylab='ACF', ci.type=par6, ci=par7, sub=mysub)
dev.off()
bitmap(file='pic2.png')
rpacf <- pacf(x,par1,main='Partial Autocorrelation',xlab='lags',ylab='PACF',sub=mysub)
dev.off()
(myacf <- c(racf$acf))
(mypacf <- c(rpacf$acf))
lengthx <- length(x)
sqrtn <- sqrt(lengthx)
load(file='createtable')
a<-table.start()
a<-table.row.start(a)
a<-table.element(a,'Autocorrelation Function',4,TRUE)
a<-table.row.end(a)
a<-table.row.start(a)
a<-table.element(a,'Time lag k',header=TRUE)
a<-table.element(a,hyperlink('basics.htm','ACF(k)','click here for more information about the Autocorrelation Function'),header=TRUE)
a<-table.element(a,'T-STAT',header=TRUE)
a<-table.element(a,'P-value',header=TRUE)
a<-table.row.end(a)
for (i in 2:(par1+1)) {
a<-table.row.start(a)
a<-table.element(a,i-1,header=TRUE)
a<-table.element(a,round(myacf[i],6))
mytstat <- myacf[i]*sqrtn
a<-table.element(a,round(mytstat,4))
a<-table.element(a,round(1-pt(abs(mytstat),lengthx),6))
a<-table.row.end(a)
}
a<-table.end(a)
table.save(a,file='mytable.tab')
a<-table.start()
a<-table.row.start(a)
a<-table.element(a,'Partial Autocorrelation Function',4,TRUE)
a<-table.row.end(a)
a<-table.row.start(a)
a<-table.element(a,'Time lag k',header=TRUE)
a<-table.element(a,hyperlink('basics.htm','PACF(k)','click here for more information about the Partial Autocorrelation Function'),header=TRUE)
a<-table.element(a,'T-STAT',header=TRUE)
a<-table.element(a,'P-value',header=TRUE)
a<-table.row.end(a)
for (i in 1:par1) {
a<-table.row.start(a)
a<-table.element(a,i,header=TRUE)
a<-table.element(a,round(mypacf[i],6))
mytstat <- mypacf[i]*sqrtn
a<-table.element(a,round(mytstat,4))
a<-table.element(a,round(1-pt(abs(mytstat),lengthx),6))
a<-table.row.end(a)
}
a<-table.end(a)
table.save(a,file='mytable1.tab')