Free Statistics
of Irreproducible Research!
Description of Statistical Computation | |||||||||||||||||||||||||||||||||||||||||||||||||||||||||||||||||||||||||||||||||||||||||||||||||||||||||||||||||||||||||||||||||||||||||||||||||||||||||||||||||||||||||||||||||||||||||||||||||||||||||||||||||||||||||||||||||||||||||||||||||||||||||||||||||||||||||||||||
|---|---|---|---|---|---|---|---|---|---|---|---|---|---|---|---|---|---|---|---|---|---|---|---|---|---|---|---|---|---|---|---|---|---|---|---|---|---|---|---|---|---|---|---|---|---|---|---|---|---|---|---|---|---|---|---|---|---|---|---|---|---|---|---|---|---|---|---|---|---|---|---|---|---|---|---|---|---|---|---|---|---|---|---|---|---|---|---|---|---|---|---|---|---|---|---|---|---|---|---|---|---|---|---|---|---|---|---|---|---|---|---|---|---|---|---|---|---|---|---|---|---|---|---|---|---|---|---|---|---|---|---|---|---|---|---|---|---|---|---|---|---|---|---|---|---|---|---|---|---|---|---|---|---|---|---|---|---|---|---|---|---|---|---|---|---|---|---|---|---|---|---|---|---|---|---|---|---|---|---|---|---|---|---|---|---|---|---|---|---|---|---|---|---|---|---|---|---|---|---|---|---|---|---|---|---|---|---|---|---|---|---|---|---|---|---|---|---|---|---|---|---|---|---|---|---|---|---|---|---|---|---|---|---|---|---|---|---|---|---|---|---|---|---|---|---|---|---|---|---|---|---|---|---|---|---|---|---|---|---|---|---|---|---|---|---|---|---|---|---|---|---|
| Author's title | |||||||||||||||||||||||||||||||||||||||||||||||||||||||||||||||||||||||||||||||||||||||||||||||||||||||||||||||||||||||||||||||||||||||||||||||||||||||||||||||||||||||||||||||||||||||||||||||||||||||||||||||||||||||||||||||||||||||||||||||||||||||||||||||||||||||||||||||
| Author | *The author of this computation has been verified* | ||||||||||||||||||||||||||||||||||||||||||||||||||||||||||||||||||||||||||||||||||||||||||||||||||||||||||||||||||||||||||||||||||||||||||||||||||||||||||||||||||||||||||||||||||||||||||||||||||||||||||||||||||||||||||||||||||||||||||||||||||||||||||||||||||||||||||||||
| R Software Module | rwasp_Two Factor ANOVA.wasp | ||||||||||||||||||||||||||||||||||||||||||||||||||||||||||||||||||||||||||||||||||||||||||||||||||||||||||||||||||||||||||||||||||||||||||||||||||||||||||||||||||||||||||||||||||||||||||||||||||||||||||||||||||||||||||||||||||||||||||||||||||||||||||||||||||||||||||||||
| Title produced by software | Two-Way ANOVA | ||||||||||||||||||||||||||||||||||||||||||||||||||||||||||||||||||||||||||||||||||||||||||||||||||||||||||||||||||||||||||||||||||||||||||||||||||||||||||||||||||||||||||||||||||||||||||||||||||||||||||||||||||||||||||||||||||||||||||||||||||||||||||||||||||||||||||||||
| Date of computation | Fri, 21 Dec 2012 10:57:24 -0500 | ||||||||||||||||||||||||||||||||||||||||||||||||||||||||||||||||||||||||||||||||||||||||||||||||||||||||||||||||||||||||||||||||||||||||||||||||||||||||||||||||||||||||||||||||||||||||||||||||||||||||||||||||||||||||||||||||||||||||||||||||||||||||||||||||||||||||||||||
| Cite this page as follows | Statistical Computations at FreeStatistics.org, Office for Research Development and Education, URL https://freestatistics.org/blog/index.php?v=date/2012/Dec/21/t1356105488diojlsziraot40v.htm/, Retrieved Fri, 19 Apr 2024 07:49:28 +0000 | ||||||||||||||||||||||||||||||||||||||||||||||||||||||||||||||||||||||||||||||||||||||||||||||||||||||||||||||||||||||||||||||||||||||||||||||||||||||||||||||||||||||||||||||||||||||||||||||||||||||||||||||||||||||||||||||||||||||||||||||||||||||||||||||||||||||||||||||
| Statistical Computations at FreeStatistics.org, Office for Research Development and Education, URL https://freestatistics.org/blog/index.php?pk=203859, Retrieved Fri, 19 Apr 2024 07:49:28 +0000 | |||||||||||||||||||||||||||||||||||||||||||||||||||||||||||||||||||||||||||||||||||||||||||||||||||||||||||||||||||||||||||||||||||||||||||||||||||||||||||||||||||||||||||||||||||||||||||||||||||||||||||||||||||||||||||||||||||||||||||||||||||||||||||||||||||||||||||||||
| QR Codes: | |||||||||||||||||||||||||||||||||||||||||||||||||||||||||||||||||||||||||||||||||||||||||||||||||||||||||||||||||||||||||||||||||||||||||||||||||||||||||||||||||||||||||||||||||||||||||||||||||||||||||||||||||||||||||||||||||||||||||||||||||||||||||||||||||||||||||||||||
|
| |||||||||||||||||||||||||||||||||||||||||||||||||||||||||||||||||||||||||||||||||||||||||||||||||||||||||||||||||||||||||||||||||||||||||||||||||||||||||||||||||||||||||||||||||||||||||||||||||||||||||||||||||||||||||||||||||||||||||||||||||||||||||||||||||||||||||||||||
| Original text written by user: | |||||||||||||||||||||||||||||||||||||||||||||||||||||||||||||||||||||||||||||||||||||||||||||||||||||||||||||||||||||||||||||||||||||||||||||||||||||||||||||||||||||||||||||||||||||||||||||||||||||||||||||||||||||||||||||||||||||||||||||||||||||||||||||||||||||||||||||||
| IsPrivate? | No (this computation is public) | ||||||||||||||||||||||||||||||||||||||||||||||||||||||||||||||||||||||||||||||||||||||||||||||||||||||||||||||||||||||||||||||||||||||||||||||||||||||||||||||||||||||||||||||||||||||||||||||||||||||||||||||||||||||||||||||||||||||||||||||||||||||||||||||||||||||||||||||
| User-defined keywords | |||||||||||||||||||||||||||||||||||||||||||||||||||||||||||||||||||||||||||||||||||||||||||||||||||||||||||||||||||||||||||||||||||||||||||||||||||||||||||||||||||||||||||||||||||||||||||||||||||||||||||||||||||||||||||||||||||||||||||||||||||||||||||||||||||||||||||||||
| Estimated Impact | 103 | ||||||||||||||||||||||||||||||||||||||||||||||||||||||||||||||||||||||||||||||||||||||||||||||||||||||||||||||||||||||||||||||||||||||||||||||||||||||||||||||||||||||||||||||||||||||||||||||||||||||||||||||||||||||||||||||||||||||||||||||||||||||||||||||||||||||||||||||
Tree of Dependent Computations | |||||||||||||||||||||||||||||||||||||||||||||||||||||||||||||||||||||||||||||||||||||||||||||||||||||||||||||||||||||||||||||||||||||||||||||||||||||||||||||||||||||||||||||||||||||||||||||||||||||||||||||||||||||||||||||||||||||||||||||||||||||||||||||||||||||||||||||||
| Family? (F = Feedback message, R = changed R code, M = changed R Module, P = changed Parameters, D = changed Data) | |||||||||||||||||||||||||||||||||||||||||||||||||||||||||||||||||||||||||||||||||||||||||||||||||||||||||||||||||||||||||||||||||||||||||||||||||||||||||||||||||||||||||||||||||||||||||||||||||||||||||||||||||||||||||||||||||||||||||||||||||||||||||||||||||||||||||||||||
| - [Chi-Squared and McNemar Tests] [] [2010-11-16 14:41:59] [b98453cac15ba1066b407e146608df68] - R P [Chi-Squared Test, McNemar Test, and Fisher Exact Test] [WS6 Chi-test Conn...] [2012-10-20 17:57:43] [bc2c61a583a6186666a33616ccc196e4] - R PD [Chi-Squared Test, McNemar Test, and Fisher Exact Test] [Deel 5 paper chi-...] [2012-12-20 20:10:47] [bc2c61a583a6186666a33616ccc196e4] - RMPD [Two-Way ANOVA] [Deel 5 paper ANOV...] [2012-12-21 15:57:24] [a6a5f8b8376d4aefaabd04a119ac2d91] [Current] | |||||||||||||||||||||||||||||||||||||||||||||||||||||||||||||||||||||||||||||||||||||||||||||||||||||||||||||||||||||||||||||||||||||||||||||||||||||||||||||||||||||||||||||||||||||||||||||||||||||||||||||||||||||||||||||||||||||||||||||||||||||||||||||||||||||||||||||||
| Feedback Forum | |||||||||||||||||||||||||||||||||||||||||||||||||||||||||||||||||||||||||||||||||||||||||||||||||||||||||||||||||||||||||||||||||||||||||||||||||||||||||||||||||||||||||||||||||||||||||||||||||||||||||||||||||||||||||||||||||||||||||||||||||||||||||||||||||||||||||||||||
Post a new message | |||||||||||||||||||||||||||||||||||||||||||||||||||||||||||||||||||||||||||||||||||||||||||||||||||||||||||||||||||||||||||||||||||||||||||||||||||||||||||||||||||||||||||||||||||||||||||||||||||||||||||||||||||||||||||||||||||||||||||||||||||||||||||||||||||||||||||||||
Dataset | |||||||||||||||||||||||||||||||||||||||||||||||||||||||||||||||||||||||||||||||||||||||||||||||||||||||||||||||||||||||||||||||||||||||||||||||||||||||||||||||||||||||||||||||||||||||||||||||||||||||||||||||||||||||||||||||||||||||||||||||||||||||||||||||||||||||||||||||
| Dataseries X: | |||||||||||||||||||||||||||||||||||||||||||||||||||||||||||||||||||||||||||||||||||||||||||||||||||||||||||||||||||||||||||||||||||||||||||||||||||||||||||||||||||||||||||||||||||||||||||||||||||||||||||||||||||||||||||||||||||||||||||||||||||||||||||||||||||||||||||||||
4 'Yes' 'Treatment' NA 'NoStats' 'No' 'No' 'Good' 4 'No' 'NoTreatment' NA 'NoStats' 'No' 'No' 'Bad' 4 'No' 'NoTreatment' NA 'NoStats' 'No' 'No' 'Bad' 4 'No' 'NoTreatment' NA 'NoStats' 'No' 'No' 'Bad' 4 'No' 'NoTreatment' NA 'NoStats' 'No' 'No' 'Bad' 4 'Yes' 'NoTreatment' NA 'NoStats' 'No' 'Yes' 'Good' 4 'No' 'NoTreatment' NA 'NoStats' 'No' 'No' 'Bad' 4 'No' 'Treatment' NA 'NoStats' 'No' 'No' 'Bad' 4 'No' 'NoTreatment' NA 'NoStats' 'No' 'No' 'Good' 4 'Yes' 'NoTreatment' NA 'NoStats' 'No' 'No' 'Bad' 4 'Yes' 'Treatment' NA 'NoStats' 'No' 'No' 'Bad' 4 'No' 'NoTreatment' NA 'NoStats' 'No' 'No' 'Bad' 4 'No' 'NoTreatment' NA 'UsedStats' 'No' 'Yes' 'Bad' 4 'Yes' 'Treatment' NA 'NoStats' 'No' 'No' 'Bad' 4 'No' 'NoTreatment' NA 'UsedStats' 'No' 'Yes' 'Good' 4 'No' 'Treatment' NA 'UsedStats' 'No' 'Yes' 'Good' 4 'Yes' 'Treatment' NA 'UsedStats' 'Yes' 'Yes' 'Bad' 4 'Yes' 'Treatment' NA 'NoStats' 'No' 'No' 'Bad' 4 'No' 'NoTreatment' NA 'NoStats' 'No' 'No' 'Good' 4 'No' 'Treatment' NA 'UsedStats' 'Yes' 'Yes' 'Good' 4 'Yes' 'NoTreatment' NA 'NoStats' 'No' 'Yes' 'Bad' 4 'Yes' 'NoTreatment' NA 'UsedStats' 'No' 'Yes' 'Good' 4 'No' 'NoTreatment' NA 'NoStats' 'No' 'Yes' 'Good' 4 'Yes' 'NoTreatment' NA 'NoStats' 'No' 'Yes' 'Good' 4 'No' 'Treatment' NA 'UsedStats' 'No' 'No' 'Good' 4 'No' 'NoTreatment' NA 'UsedStats' 'No' 'Yes' 'Bad' 4 'Yes' 'NoTreatment' NA 'NoStats' 'No' 'No' 'Good' 4 'No' 'NoTreatment' NA 'UsedStats' 'No' 'No' 'Bad' 4 'No' 'NoTreatment' NA 'NoStats' 'No' 'No' 'Good' 4 'No' 'NoTreatment' NA 'NoStats' 'No' 'Yes' 'Bad' 4 'No' 'NoTreatment' NA 'NoStats' 'No' 'No' 'Bad' 4 'Yes' 'NoTreatment' NA 'NoStats' 'No' 'No' 'Bad' 4 'Yes' 'NoTreatment' NA 'NoStats' 'No' 'Yes' 'Bad' 4 'No' 'Treatment' NA 'NoStats' 'No' 'No' 'Good' 4 'No' 'NoTreatment' NA 'NoStats' 'No' 'No' 'Bad' 4 'No' 'NoTreatment' NA 'NoStats' 'No' 'No' 'Bad' 4 'Yes' 'Treatment' NA 'UsedStats' 'No' 'Yes' 'Bad' 4 'No' 'NoTreatment' NA 'UsedStats' 'No' 'No' 'Good' 4 'No' 'NoTreatment' NA 'NoStats' 'No' 'Yes' 'Good' 4 'No' 'Treatment' NA 'NoStats' 'No' 'Yes' 'Bad' 4 'No' 'NoTreatment' NA 'UsedStats' 'Yes' 'Yes' 'Good' 4 'No' 'NoTreatment' NA 'UsedStats' 'No' 'No' 'Good' 4 'Yes' 'NoTreatment' NA 'NoStats' 'No' 'Yes' 'Good' 4 'Yes' 'Treatment' NA 'NoStats' 'No' 'No' 'Bad' 4 'No' 'NoTreatment' NA 'NoStats' 'No' 'Yes' 'Bad' 4 'No' 'NoTreatment' NA 'NoStats' 'No' 'Yes' 'Good' 4 'No' 'NoTreatment' NA 'NoStats' 'No' 'No' 'Bad' 4 'No' 'NoTreatment' NA 'NoStats' 'No' 'No' 'Good' 4 'No' 'NoTreatment' NA 'NoStats' 'No' 'Yes' 'Good' 4 'No' 'NoTreatment' NA 'NoStats' 'No' 'No' 'Bad' 4 'No' 'Treatment' NA 'UsedStats' 'No' 'No' 'Bad' 4 'Yes' 'Treatment' NA 'UsedStats' 'Yes' 'Yes' 'Bad' 4 'No' 'NoTreatment' NA 'NoStats' 'No' 'No' 'Good' 4 'No' 'NoTreatment' NA 'UsedStats' 'Yes' 'No' 'Bad' 4 'No' 'NoTreatment' NA 'NoStats' 'No' 'No' 'Bad' 4 'No' 'Treatment' NA 'UsedStats' 'No' 'No' 'Good' 4 'No' 'NoTreatment' NA 'UsedStats' 'No' 'Yes' 'Good' 4 'No' 'NoTreatment' NA 'NoStats' 'No' 'No' 'Good' 4 'No' 'NoTreatment' NA 'NoStats' 'No' 'No' 'Good' 4 'Yes' 'Treatment' NA 'UsedStats' 'Yes' 'Yes' 'Good' 4 'Yes' 'Treatment' NA 'NoStats' 'No' 'No' 'Good' 4 'No' 'NoTreatment' NA 'UsedStats' 'No' 'Yes' 'Bad' 4 'No' 'NoTreatment' NA 'NoStats' 'No' 'No' 'Bad' 4 'Yes' 'Treatment' NA 'NoStats' 'No' 'No' 'Good' 4 'No' 'NoTreatment' NA 'NoStats' 'No' 'No' 'Bad' 4 'No' 'NoTreatment' NA 'NoStats' 'No' 'No' 'Bad' 4 'No' 'Treatment' NA 'UsedStats' 'Yes' 'Yes' 'Bad' 4 'Yes' 'NoTreatment' NA 'NoStats' 'No' 'No' 'Bad' 4 'No' 'NoTreatment' NA 'NoStats' 'No' 'No' 'Good' 4 'No' 'NoTreatment' NA 'UsedStats' 'No' 'No' 'Bad' 4 'No' 'NoTreatment' NA 'NoStats' 'No' 'No' 'Bad' 4 'No' 'NoTreatment' NA 'NoStats' 'No' 'No' 'Good' 4 'No' 'NoTreatment' NA 'UsedStats' 'No' 'No' 'Good' 4 'Yes' 'NoTreatment' NA 'UsedStats' 'No' 'No' 'Bad' 4 'No' 'NoTreatment' NA 'NoStats' 'No' 'No' 'Good' 4 'No' 'Treatment' NA 'NoStats' 'No' 'Yes' 'Good' 4 'No' 'NoTreatment' NA 'NoStats' 'No' 'No' 'Good' 4 'No' 'NoTreatment' NA 'UsedStats' 'No' 'Yes' 'Good' 4 'No' 'Treatment' NA 'UsedStats' 'Yes' 'No' 'Good' 4 'No' 'Treatment' NA 'NoStats' 'No' 'Yes' 'Bad' 4 'No' 'NoTreatment' NA 'NoStats' 'No' 'No' 'Bad' 4 'Yes' 'NoTreatment' NA 'UsedStats' 'No' 'No' 'Good' 4 'No' 'NoTreatment' NA 'NoStats' 'No' 'No' 'Bad' 4 'No' 'NoTreatment' NA 'UsedStats' 'Yes' 'No' 'Bad' 4 'No' 'NoTreatment' NA 'NoStats' 'No' 'Yes' 'Good' 4 'Yes' 'NoTreatment' NA 'NoStats' 'No' 'No' 'Bad' 2 'Yes' NA 'NoTreatment' 'NoStats' 'No' 'No' 'Good' 2 'Yes' NA 'Treatment' 'UsedStats' 'No' 'No' 'Good' 2 'No' NA 'NoTreatment' 'NoStats' 'No' 'No' 'Bad' 2 'No' NA 'NoTreatment' 'NoStats' 'No' 'No' 'Good' 2 'No' NA 'NoTreatment' 'NoStats' 'No' 'Yes' 'Bad' 2 'Yes' NA 'Treatment' 'NoStats' 'No' 'No' 'Bad' 2 'Yes' NA 'NoTreatment' 'NoStats' 'No' 'Yes' 'Bad' 2 'No' NA 'NoTreatment' 'NoStats' 'No' 'No' 'Bad' 2 'No' NA 'Treatment' 'NoStats' 'No' 'No' 'Bad' 2 'No' NA 'NoTreatment' 'NoStats' 'No' 'No' 'Good' 2 'Yes' NA 'Treatment' 'NoStats' 'No' 'No' 'Bad' 2 'No' NA 'NoTreatment' 'NoStats' 'No' 'No' 'Bad' 2 'Yes' NA 'NoTreatment' 'NoStats' 'No' 'No' 'Bad' 2 'No' NA 'NoTreatment' 'NoStats' 'No' 'No' 'Good' 2 'Yes' NA 'NoTreatment' 'NoStats' 'No' 'No' 'Good' 2 'No' NA 'NoTreatment' 'NoStats' 'No' 'No' 'Bad' 2 'No' NA 'NoTreatment' 'NoStats' 'No' 'No' 'Bad' 2 'No' NA 'NoTreatment' 'NoStats' 'No' 'No' 'Bad' 2 'No' NA 'Treatment' 'UsedStats' 'No' 'No' 'Bad' 2 'No' NA 'NoTreatment' 'NoStats' 'No' 'No' 'Bad' 2 'No' NA 'NoTreatment' 'NoStats' 'No' 'No' 'Bad' 2 'Yes' NA 'Treatment' 'UsedStats' 'No' 'No' 'Bad' 2 'No' NA 'NoTreatment' 'NoStats' 'No' 'No' 'Bad' 2 'Yes' NA 'NoTreatment' 'NoStats' 'No' 'No' 'Bad' 2 'Yes' NA 'Treatment' 'UsedStats' 'No' 'Yes' 'Bad' 2 'No' NA 'Treatment' 'NoStats' 'No' 'No' 'Bad' 2 'No' NA 'NoTreatment' 'UsedStats' 'No' 'No' 'Bad' 2 'Yes' NA 'Treatment' 'UsedStats' 'No' 'No' 'Bad' 2 'Yes' NA 'NoTreatment' 'NoStats' 'No' 'No' 'Bad' 2 'No' NA 'NoTreatment' 'NoStats' 'No' 'No' 'Bad' 2 'Yes' NA 'NoTreatment' 'NoStats' 'No' 'No' 'Good' 2 'Yes' NA 'NoTreatment' 'NoStats' 'No' 'No' 'Bad' 2 'No' NA 'NoTreatment' 'NoStats' 'No' 'No' 'Bad' 2 'No' NA 'NoTreatment' 'NoStats' 'No' 'No' 'Good' 2 'Yes' NA 'NoTreatment' 'NoStats' 'No' 'No' 'Bad' 2 'No' NA 'NoTreatment' 'NoStats' 'No' 'No' 'Bad' 2 'Yes' NA 'Treatment' 'UsedStats' 'No' 'No' 'Bad' 2 'No' NA 'NoTreatment' 'UsedStats' 'No' 'Yes' 'Good' 2 'No' NA 'NoTreatment' 'NoStats' 'No' 'No' 'Good' 2 'No' NA 'Treatment' 'NoStats' 'No' 'No' 'Bad' 2 'No' NA 'NoTreatment' 'NoStats' 'No' 'Yes' 'Bad' 2 'No' NA 'NoTreatment' 'NoStats' 'No' 'No' 'Good' 2 'No' NA 'NoTreatment' 'NoStats' 'No' 'No' 'Bad' 2 'No' NA 'NoTreatment' 'NoStats' 'No' 'No' 'Good' 2 'Yes' NA 'NoTreatment' 'NoStats' 'No' 'No' 'Bad' 2 'Yes' NA 'NoTreatment' 'NoStats' 'No' 'No' 'Good' 2 'Yes' NA 'NoTreatment' 'UsedStats' 'No' 'No' 'Bad' 2 'No' NA 'NoTreatment' 'NoStats' 'No' 'No' 'Bad' 2 'No' NA 'NoTreatment' 'NoStats' 'No' 'No' 'Bad' 2 'No' NA 'NoTreatment' 'NoStats' 'No' 'No' 'Bad' 2 'Yes' NA 'NoTreatment' 'UsedStats' 'No' 'Yes' 'Good' 2 'Yes' NA 'Treatment' 'UsedStats' 'No' 'Yes' 'Good' 2 'No' NA 'Treatment' 'NoStats' 'No' 'No' 'Bad' 2 'No' NA 'NoTreatment' 'NoStats' 'No' 'No' 'Bad' 2 'No' NA 'NoTreatment' 'UsedStats' 'Yes' 'No' 'Good' 2 'No' NA 'Treatment' 'UsedStats' 'No' 'No' 'Good' 2 'Yes' NA 'NoTreatment' 'NoStats' 'No' 'No' 'Bad' 2 'No' NA 'NoTreatment' 'NoStats' 'No' 'Yes' 'Good' 2 'No' NA 'NoTreatment' 'NoStats' 'No' 'Yes' 'Bad' 2 'No' NA 'Treatment' 'NoStats' 'No' 'No' 'Good' 2 'No' NA 'Treatment' 'UsedStats' 'No' 'No' 'Bad' 2 'No' NA 'Treatment' 'NoStats' 'No' 'No' 'Bad' 2 'Yes' NA 'NoTreatment' 'NoStats' 'No' 'No' 'Bad' 2 'No' NA 'NoTreatment' 'NoStats' 'No' 'Yes' 'Good' 2 'No' NA 'NoTreatment' 'NoStats' 'No' 'No' 'Good' 2 'Yes' NA 'NoTreatment' 'UsedStats' 'Yes' 'No' 'Bad' 2 'Yes' NA 'NoTreatment' 'UsedStats' 'Yes' 'Yes' 'Bad' 2 'Yes' NA 'NoTreatment' 'UsedStats' 'No' 'No' 'Bad' | |||||||||||||||||||||||||||||||||||||||||||||||||||||||||||||||||||||||||||||||||||||||||||||||||||||||||||||||||||||||||||||||||||||||||||||||||||||||||||||||||||||||||||||||||||||||||||||||||||||||||||||||||||||||||||||||||||||||||||||||||||||||||||||||||||||||||||||||
Tables (Output of Computation) | |||||||||||||||||||||||||||||||||||||||||||||||||||||||||||||||||||||||||||||||||||||||||||||||||||||||||||||||||||||||||||||||||||||||||||||||||||||||||||||||||||||||||||||||||||||||||||||||||||||||||||||||||||||||||||||||||||||||||||||||||||||||||||||||||||||||||||||||
| |||||||||||||||||||||||||||||||||||||||||||||||||||||||||||||||||||||||||||||||||||||||||||||||||||||||||||||||||||||||||||||||||||||||||||||||||||||||||||||||||||||||||||||||||||||||||||||||||||||||||||||||||||||||||||||||||||||||||||||||||||||||||||||||||||||||||||||||
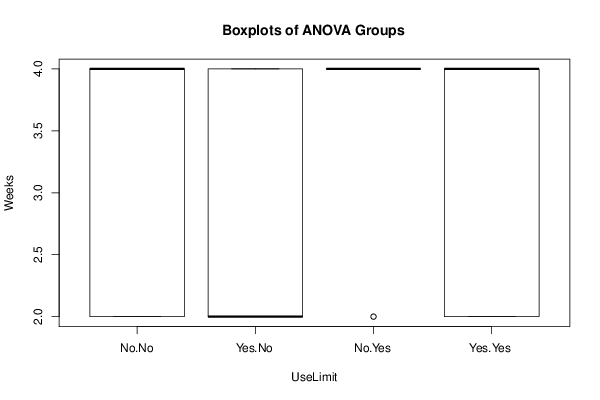
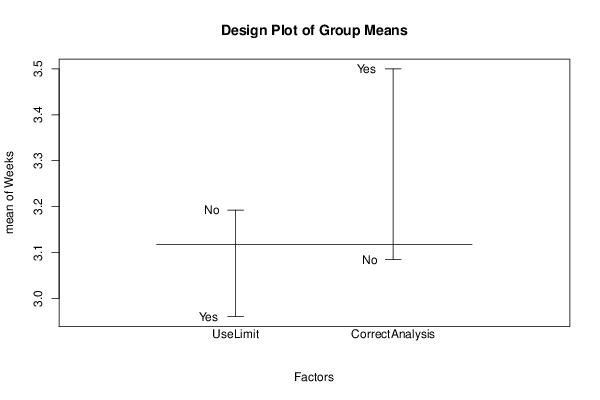
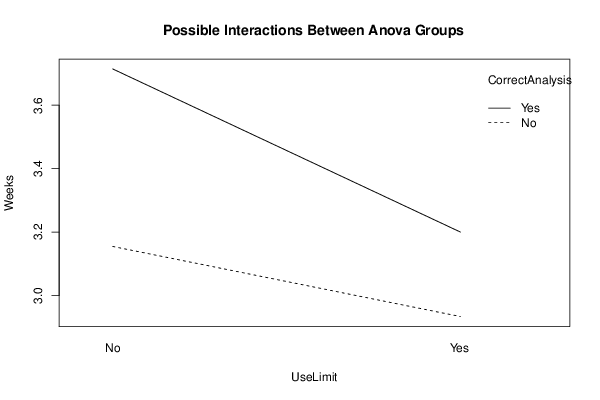
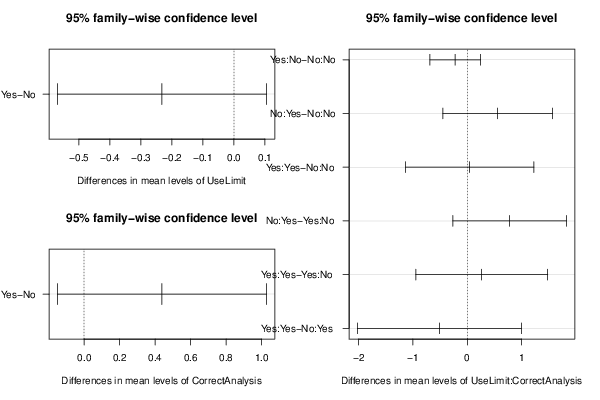
Figures (Output of Computation) | |||||||||||||||||||||||||||||||||||||||||||||||||||||||||||||||||||||||||||||||||||||||||||||||||||||||||||||||||||||||||||||||||||||||||||||||||||||||||||||||||||||||||||||||||||||||||||||||||||||||||||||||||||||||||||||||||||||||||||||||||||||||||||||||||||||||||||||||
Input Parameters & R Code | |||||||||||||||||||||||||||||||||||||||||||||||||||||||||||||||||||||||||||||||||||||||||||||||||||||||||||||||||||||||||||||||||||||||||||||||||||||||||||||||||||||||||||||||||||||||||||||||||||||||||||||||||||||||||||||||||||||||||||||||||||||||||||||||||||||||||||||||
| Parameters (Session): | |||||||||||||||||||||||||||||||||||||||||||||||||||||||||||||||||||||||||||||||||||||||||||||||||||||||||||||||||||||||||||||||||||||||||||||||||||||||||||||||||||||||||||||||||||||||||||||||||||||||||||||||||||||||||||||||||||||||||||||||||||||||||||||||||||||||||||||||
| par1 = 1 ; par2 = 2 ; par3 = 6 ; par4 = TRUE ; | |||||||||||||||||||||||||||||||||||||||||||||||||||||||||||||||||||||||||||||||||||||||||||||||||||||||||||||||||||||||||||||||||||||||||||||||||||||||||||||||||||||||||||||||||||||||||||||||||||||||||||||||||||||||||||||||||||||||||||||||||||||||||||||||||||||||||||||||
| Parameters (R input): | |||||||||||||||||||||||||||||||||||||||||||||||||||||||||||||||||||||||||||||||||||||||||||||||||||||||||||||||||||||||||||||||||||||||||||||||||||||||||||||||||||||||||||||||||||||||||||||||||||||||||||||||||||||||||||||||||||||||||||||||||||||||||||||||||||||||||||||||
| par1 = 1 ; par2 = 2 ; par3 = 6 ; par4 = TRUE ; | |||||||||||||||||||||||||||||||||||||||||||||||||||||||||||||||||||||||||||||||||||||||||||||||||||||||||||||||||||||||||||||||||||||||||||||||||||||||||||||||||||||||||||||||||||||||||||||||||||||||||||||||||||||||||||||||||||||||||||||||||||||||||||||||||||||||||||||||
| R code (references can be found in the software module): | |||||||||||||||||||||||||||||||||||||||||||||||||||||||||||||||||||||||||||||||||||||||||||||||||||||||||||||||||||||||||||||||||||||||||||||||||||||||||||||||||||||||||||||||||||||||||||||||||||||||||||||||||||||||||||||||||||||||||||||||||||||||||||||||||||||||||||||||
par4 <- 'TRUE' | |||||||||||||||||||||||||||||||||||||||||||||||||||||||||||||||||||||||||||||||||||||||||||||||||||||||||||||||||||||||||||||||||||||||||||||||||||||||||||||||||||||||||||||||||||||||||||||||||||||||||||||||||||||||||||||||||||||||||||||||||||||||||||||||||||||||||||||||