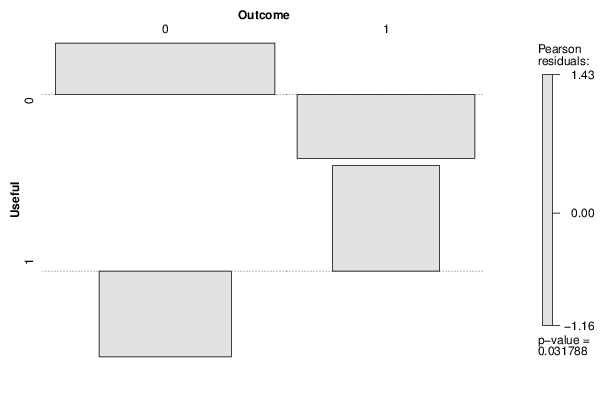
| Tabulation of Results | ||
| Useful x Outcome | ||
| 0 | 1 | 0 | 74 | 39 | 1 | 19 | 22 |
| Tabulation of Expected Results | ||
| Useful x Outcome | ||
| 0 | 1 | 0 | 68.24 | 44.76 | 1 | 24.76 | 16.24 |
| Statistical Results | |
| Pearson's Chi-squared test with simulated p-value (based on 2000 replicates) | |
| Exact Pearson Chi Square Statistic | 4.61 |
| P value | 0.04 |