Free Statistics

of Irreproducible Research!

Author's title

Author*The author of this computation has been verified*
R Software Modulerwasp_arimabackwardselection.wasp
Title produced by softwareARIMA Backward Selection
Date of computationFri, 21 Dec 2012 09:28:22 -0500
Cite this page as followsStatistical Computations at FreeStatistics.org, Office for Research Development and Education, URL https://freestatistics.org/blog/index.php?v=date/2012/Dec/21/t1356100844drp9dwta9d0owo0.htm/, Retrieved Fri, 26 Apr 2024 09:32:46 +0000
Statistical Computations at FreeStatistics.org, Office for Research Development and Education, URL https://freestatistics.org/blog/index.php?pk=203740, Retrieved Fri, 26 Apr 2024 09:32:46 +0000
QR Codes:

Original text written by user:
IsPrivate?No (this computation is public)
User-defined keywords
Estimated Impact63
Family? (F = Feedback message, R = changed R code, M = changed R Module, P = changed Parameters, D = changed Data)
-       [ARIMA Backward Selection] [] [2012-12-21 14:28:22] [647590d21113774a1754266cc86dbc25] [Current]
Feedback Forum

Post a new message
Dataseries X:
41
39
50
40
43
38
44
35
39
35
29
49
50
59
63
32
39
47
53
60
57
52
70
90
74
62
55
84
94
70
108
139
120
97
126
149
158
124
140
109
114
77
120
133
110
92
97
78
99
107
112
90
98
125
155
190
236
189
174
178
136
161
171
149
184
155
276
224
213
279
268
287
238
213
257
293
212
246
353
339
308
247
257
322
298
273
312
249
286
279
309
401
309
328
353
354
327
324
285
243
241
287
355
460
364
487
452
391
500
451
375
372
302
316
398
394
431
431


Summary of computational transaction
Raw Inputview raw input (R code)
Raw Outputview raw output of R engine
Computing time5 seconds
R Server'Gertrude Mary Cox' @ cox.wessa.net

\begin{tabular}{lllllllll}
\hline
Summary of computational transaction \tabularnewline
Raw Input & view raw input (R code)  \tabularnewline
Raw Output & view raw output of R engine  \tabularnewline
Computing time & 5 seconds \tabularnewline
R Server & 'Gertrude Mary Cox' @ cox.wessa.net \tabularnewline
\hline
\end{tabular}
%Source: https://freestatistics.org/blog/index.php?pk=203740&T=0

[TABLE]
[ROW][C]Summary of computational transaction[/C][/ROW]
[ROW][C]Raw Input[/C][C]view raw input (R code) [/C][/ROW]
[ROW][C]Raw Output[/C][C]view raw output of R engine [/C][/ROW]
[ROW][C]Computing time[/C][C]5 seconds[/C][/ROW]
[ROW][C]R Server[/C][C]'Gertrude Mary Cox' @ cox.wessa.net[/C][/ROW]
[/TABLE]
Source: https://freestatistics.org/blog/index.php?pk=203740&T=0

Globally Unique Identifier (entire table): ba.freestatistics.org/blog/index.php?pk=203740&T=0

As an alternative you can also use a QR Code:  

The GUIDs for individual cells are displayed in the table below:

Summary of computational transaction
Raw Inputview raw input (R code)
Raw Outputview raw output of R engine
Computing time5 seconds
R Server'Gertrude Mary Cox' @ cox.wessa.net


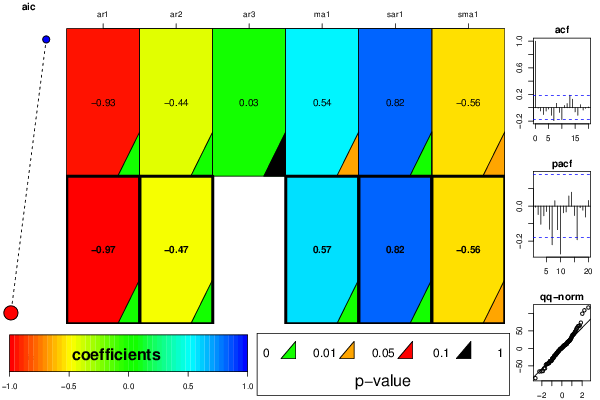
ARIMA Parameter Estimation and Backward Selection
Iterationar1ar2ar3ma1sar1sma1
Estimates ( 1 )-0.9296-0.43690.03040.53870.8204-0.5597
(p-val)(1e-04 )(0.0079 )(0.8067 )(0.012 )(0 )(0.0201 )
Estimates ( 2 )-0.9721-0.470300.57330.8204-0.559
(p-val)(0 )(0 )(NA )(3e-04 )(0 )(0.0195 )
Estimates ( 3 )NANANANANANA
(p-val)(NA )(NA )(NA )(NA )(NA )(NA )
Estimates ( 4 )NANANANANANA
(p-val)(NA )(NA )(NA )(NA )(NA )(NA )
Estimates ( 5 )NANANANANANA
(p-val)(NA )(NA )(NA )(NA )(NA )(NA )
Estimates ( 6 )NANANANANANA
(p-val)(NA )(NA )(NA )(NA )(NA )(NA )
Estimates ( 7 )NANANANANANA
(p-val)(NA )(NA )(NA )(NA )(NA )(NA )
Estimates ( 8 )NANANANANANA
(p-val)(NA )(NA )(NA )(NA )(NA )(NA )
Estimates ( 9 )NANANANANANA
(p-val)(NA )(NA )(NA )(NA )(NA )(NA )
Estimates ( 10 )NANANANANANA
(p-val)(NA )(NA )(NA )(NA )(NA )(NA )
Estimates ( 11 )NANANANANANA
(p-val)(NA )(NA )(NA )(NA )(NA )(NA )

\begin{tabular}{lllllllll}
\hline
ARIMA Parameter Estimation and Backward Selection \tabularnewline
Iteration & ar1 & ar2 & ar3 & ma1 & sar1 & sma1 \tabularnewline
Estimates ( 1 ) & -0.9296 & -0.4369 & 0.0304 & 0.5387 & 0.8204 & -0.5597 \tabularnewline
(p-val) & (1e-04 ) & (0.0079 ) & (0.8067 ) & (0.012 ) & (0 ) & (0.0201 ) \tabularnewline
Estimates ( 2 ) & -0.9721 & -0.4703 & 0 & 0.5733 & 0.8204 & -0.559 \tabularnewline
(p-val) & (0 ) & (0 ) & (NA ) & (3e-04 ) & (0 ) & (0.0195 ) \tabularnewline
Estimates ( 3 ) & NA & NA & NA & NA & NA & NA \tabularnewline
(p-val) & (NA ) & (NA ) & (NA ) & (NA ) & (NA ) & (NA ) \tabularnewline
Estimates ( 4 ) & NA & NA & NA & NA & NA & NA \tabularnewline
(p-val) & (NA ) & (NA ) & (NA ) & (NA ) & (NA ) & (NA ) \tabularnewline
Estimates ( 5 ) & NA & NA & NA & NA & NA & NA \tabularnewline
(p-val) & (NA ) & (NA ) & (NA ) & (NA ) & (NA ) & (NA ) \tabularnewline
Estimates ( 6 ) & NA & NA & NA & NA & NA & NA \tabularnewline
(p-val) & (NA ) & (NA ) & (NA ) & (NA ) & (NA ) & (NA ) \tabularnewline
Estimates ( 7 ) & NA & NA & NA & NA & NA & NA \tabularnewline
(p-val) & (NA ) & (NA ) & (NA ) & (NA ) & (NA ) & (NA ) \tabularnewline
Estimates ( 8 ) & NA & NA & NA & NA & NA & NA \tabularnewline
(p-val) & (NA ) & (NA ) & (NA ) & (NA ) & (NA ) & (NA ) \tabularnewline
Estimates ( 9 ) & NA & NA & NA & NA & NA & NA \tabularnewline
(p-val) & (NA ) & (NA ) & (NA ) & (NA ) & (NA ) & (NA ) \tabularnewline
Estimates ( 10 ) & NA & NA & NA & NA & NA & NA \tabularnewline
(p-val) & (NA ) & (NA ) & (NA ) & (NA ) & (NA ) & (NA ) \tabularnewline
Estimates ( 11 ) & NA & NA & NA & NA & NA & NA \tabularnewline
(p-val) & (NA ) & (NA ) & (NA ) & (NA ) & (NA ) & (NA ) \tabularnewline
\hline
\end{tabular}
%Source: https://freestatistics.org/blog/index.php?pk=203740&T=1

[TABLE]
[ROW][C]ARIMA Parameter Estimation and Backward Selection[/C][/ROW]
[ROW][C]Iteration[/C][C]ar1[/C][C]ar2[/C][C]ar3[/C][C]ma1[/C][C]sar1[/C][C]sma1[/C][/ROW]
[ROW][C]Estimates ( 1 )[/C][C]-0.9296[/C][C]-0.4369[/C][C]0.0304[/C][C]0.5387[/C][C]0.8204[/C][C]-0.5597[/C][/ROW]
[ROW][C](p-val)[/C][C](1e-04 )[/C][C](0.0079 )[/C][C](0.8067 )[/C][C](0.012 )[/C][C](0 )[/C][C](0.0201 )[/C][/ROW]
[ROW][C]Estimates ( 2 )[/C][C]-0.9721[/C][C]-0.4703[/C][C]0[/C][C]0.5733[/C][C]0.8204[/C][C]-0.559[/C][/ROW]
[ROW][C](p-val)[/C][C](0 )[/C][C](0 )[/C][C](NA )[/C][C](3e-04 )[/C][C](0 )[/C][C](0.0195 )[/C][/ROW]
[ROW][C]Estimates ( 3 )[/C][C]NA[/C][C]NA[/C][C]NA[/C][C]NA[/C][C]NA[/C][C]NA[/C][/ROW]
[ROW][C](p-val)[/C][C](NA )[/C][C](NA )[/C][C](NA )[/C][C](NA )[/C][C](NA )[/C][C](NA )[/C][/ROW]
[ROW][C]Estimates ( 4 )[/C][C]NA[/C][C]NA[/C][C]NA[/C][C]NA[/C][C]NA[/C][C]NA[/C][/ROW]
[ROW][C](p-val)[/C][C](NA )[/C][C](NA )[/C][C](NA )[/C][C](NA )[/C][C](NA )[/C][C](NA )[/C][/ROW]
[ROW][C]Estimates ( 5 )[/C][C]NA[/C][C]NA[/C][C]NA[/C][C]NA[/C][C]NA[/C][C]NA[/C][/ROW]
[ROW][C](p-val)[/C][C](NA )[/C][C](NA )[/C][C](NA )[/C][C](NA )[/C][C](NA )[/C][C](NA )[/C][/ROW]
[ROW][C]Estimates ( 6 )[/C][C]NA[/C][C]NA[/C][C]NA[/C][C]NA[/C][C]NA[/C][C]NA[/C][/ROW]
[ROW][C](p-val)[/C][C](NA )[/C][C](NA )[/C][C](NA )[/C][C](NA )[/C][C](NA )[/C][C](NA )[/C][/ROW]
[ROW][C]Estimates ( 7 )[/C][C]NA[/C][C]NA[/C][C]NA[/C][C]NA[/C][C]NA[/C][C]NA[/C][/ROW]
[ROW][C](p-val)[/C][C](NA )[/C][C](NA )[/C][C](NA )[/C][C](NA )[/C][C](NA )[/C][C](NA )[/C][/ROW]
[ROW][C]Estimates ( 8 )[/C][C]NA[/C][C]NA[/C][C]NA[/C][C]NA[/C][C]NA[/C][C]NA[/C][/ROW]
[ROW][C](p-val)[/C][C](NA )[/C][C](NA )[/C][C](NA )[/C][C](NA )[/C][C](NA )[/C][C](NA )[/C][/ROW]
[ROW][C]Estimates ( 9 )[/C][C]NA[/C][C]NA[/C][C]NA[/C][C]NA[/C][C]NA[/C][C]NA[/C][/ROW]
[ROW][C](p-val)[/C][C](NA )[/C][C](NA )[/C][C](NA )[/C][C](NA )[/C][C](NA )[/C][C](NA )[/C][/ROW]
[ROW][C]Estimates ( 10 )[/C][C]NA[/C][C]NA[/C][C]NA[/C][C]NA[/C][C]NA[/C][C]NA[/C][/ROW]
[ROW][C](p-val)[/C][C](NA )[/C][C](NA )[/C][C](NA )[/C][C](NA )[/C][C](NA )[/C][C](NA )[/C][/ROW]
[ROW][C]Estimates ( 11 )[/C][C]NA[/C][C]NA[/C][C]NA[/C][C]NA[/C][C]NA[/C][C]NA[/C][/ROW]
[ROW][C](p-val)[/C][C](NA )[/C][C](NA )[/C][C](NA )[/C][C](NA )[/C][C](NA )[/C][C](NA )[/C][/ROW]
[/TABLE]
Source: https://freestatistics.org/blog/index.php?pk=203740&T=1

Globally Unique Identifier (entire table): ba.freestatistics.org/blog/index.php?pk=203740&T=1

As an alternative you can also use a QR Code:  

The GUIDs for individual cells are displayed in the table below:

ARIMA Parameter Estimation and Backward Selection
Iterationar1ar2ar3ma1sar1sma1
Estimates ( 1 )-0.9296-0.43690.03040.53870.8204-0.5597
(p-val)(1e-04 )(0.0079 )(0.8067 )(0.012 )(0 )(0.0201 )
Estimates ( 2 )-0.9721-0.470300.57330.8204-0.559
(p-val)(0 )(0 )(NA )(3e-04 )(0 )(0.0195 )
Estimates ( 3 )NANANANANANA
(p-val)(NA )(NA )(NA )(NA )(NA )(NA )
Estimates ( 4 )NANANANANANA
(p-val)(NA )(NA )(NA )(NA )(NA )(NA )
Estimates ( 5 )NANANANANANA
(p-val)(NA )(NA )(NA )(NA )(NA )(NA )
Estimates ( 6 )NANANANANANA
(p-val)(NA )(NA )(NA )(NA )(NA )(NA )
Estimates ( 7 )NANANANANANA
(p-val)(NA )(NA )(NA )(NA )(NA )(NA )
Estimates ( 8 )NANANANANANA
(p-val)(NA )(NA )(NA )(NA )(NA )(NA )
Estimates ( 9 )NANANANANANA
(p-val)(NA )(NA )(NA )(NA )(NA )(NA )
Estimates ( 10 )NANANANANANA
(p-val)(NA )(NA )(NA )(NA )(NA )(NA )
Estimates ( 11 )NANANANANANA
(p-val)(NA )(NA )(NA )(NA )(NA )(NA )


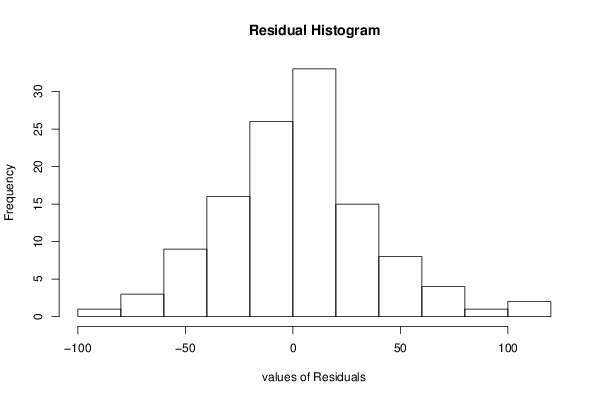
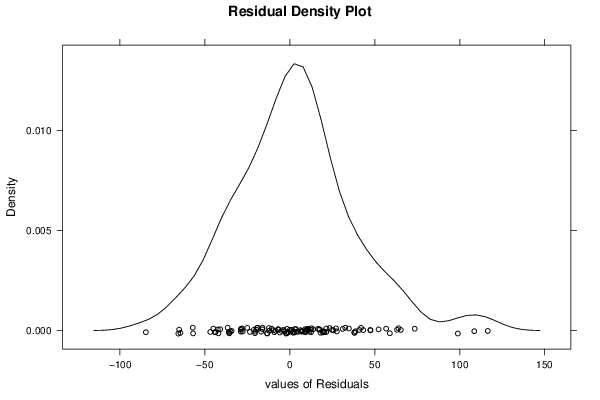
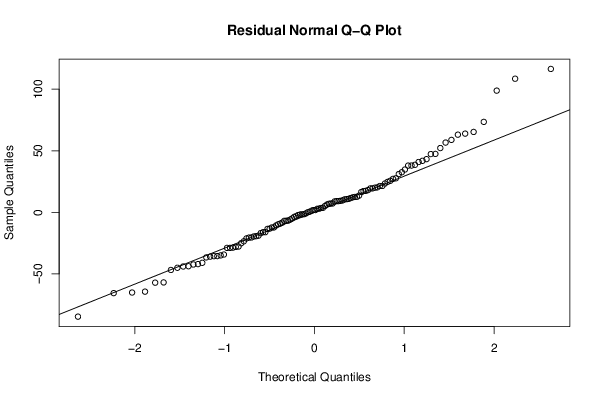
Estimated ARIMA Residuals
Value
0.0409999680813096
-1.60279964492074
8.82447361885632
-4.94761107607199
1.31997600692915
-6.93109951038768
6.27136180014695
-8.36703299365229
2.98605207385911
-5.87206455393686
-3.20040797256286
12.4829198191867
9.10285540951901
13.6000915842102
1.86366474143316
-23.5070027088168
-6.70238990007883
6.87539556988858
12.1817350624816
10.9183658695789
0.447103064988039
-3.6907994307447
16.5017363786339
20.3042171889317
-6.82647472081156
-20.4409868529086
-19.3640557615179
34.7666198213034
21.388538488087
-12.2460780522811
20.0159726246018
40.8839859436008
3.51215748399611
-27.7911146464848
11.5997627719312
21.4364584811034
25.6199270543078
-28.1464048511635
7.12314852121743
-36.0093125542921
-2.18522517610963
-44.0119266532121
27.1626894864584
5.10238771018833
-1.85619561760742
-25.0977202382128
-9.19056569421521
-34.2955325134522
9.36661436270424
19.4677592586415
17.291868924285
-16.1276834623894
-0.909861823073184
37.9527938524243
31.0860458921549
38.6002489990903
63.0852945156827
-9.71565472599102
-28.8868533166945
-20.5473238072305
-42.3786440785772
9.06210622682762
7.22764852135031
3.6810790337053
19.4226858949464
-16.1266593439243
98.8699564442992
-36.6258924746581
-13.4476113428822
41.8603833496451
38.0211409056186
23.4126349952751
-45.0481785806668
-35.6274890935836
12.6284805704117
65.3157095323229
-65.6446591476875
10.5133604597465
56.6824548433617
43.2087848493126
-35.5538893299337
-84.7568301241387
-18.9346714433155
52.2212418023078
27.6671289635803
-16.8462689226332
9.70482078829293
-57.1495058408181
32.5675916433793
-10.6880601365869
-1.54894460700751
73.4851565542768
-41.0027921930313
18.0572318798463
2.86672358318304
17.4571281735184
-28.8896722599033
1.81504649461652
-56.9428058929578
-46.8324559514357
-28.6762523680829
47.3411025178685
47.4704730929327
108.547795065956
-34.9618494124655
116.48589722398
-21.2193492574044
-43.8042614795223
58.8464964290146
10.6695453608548
-65.1633153246355
-42.0617381692542
-64.4413547094991
-19.638174299647
24.750108065081
-12.3153072769743
63.9283973159614
-13.248885372484

\begin{tabular}{lllllllll}
\hline
Estimated ARIMA Residuals \tabularnewline
Value \tabularnewline
0.0409999680813096 \tabularnewline
-1.60279964492074 \tabularnewline
8.82447361885632 \tabularnewline
-4.94761107607199 \tabularnewline
1.31997600692915 \tabularnewline
-6.93109951038768 \tabularnewline
6.27136180014695 \tabularnewline
-8.36703299365229 \tabularnewline
2.98605207385911 \tabularnewline
-5.87206455393686 \tabularnewline
-3.20040797256286 \tabularnewline
12.4829198191867 \tabularnewline
9.10285540951901 \tabularnewline
13.6000915842102 \tabularnewline
1.86366474143316 \tabularnewline
-23.5070027088168 \tabularnewline
-6.70238990007883 \tabularnewline
6.87539556988858 \tabularnewline
12.1817350624816 \tabularnewline
10.9183658695789 \tabularnewline
0.447103064988039 \tabularnewline
-3.6907994307447 \tabularnewline
16.5017363786339 \tabularnewline
20.3042171889317 \tabularnewline
-6.82647472081156 \tabularnewline
-20.4409868529086 \tabularnewline
-19.3640557615179 \tabularnewline
34.7666198213034 \tabularnewline
21.388538488087 \tabularnewline
-12.2460780522811 \tabularnewline
20.0159726246018 \tabularnewline
40.8839859436008 \tabularnewline
3.51215748399611 \tabularnewline
-27.7911146464848 \tabularnewline
11.5997627719312 \tabularnewline
21.4364584811034 \tabularnewline
25.6199270543078 \tabularnewline
-28.1464048511635 \tabularnewline
7.12314852121743 \tabularnewline
-36.0093125542921 \tabularnewline
-2.18522517610963 \tabularnewline
-44.0119266532121 \tabularnewline
27.1626894864584 \tabularnewline
5.10238771018833 \tabularnewline
-1.85619561760742 \tabularnewline
-25.0977202382128 \tabularnewline
-9.19056569421521 \tabularnewline
-34.2955325134522 \tabularnewline
9.36661436270424 \tabularnewline
19.4677592586415 \tabularnewline
17.291868924285 \tabularnewline
-16.1276834623894 \tabularnewline
-0.909861823073184 \tabularnewline
37.9527938524243 \tabularnewline
31.0860458921549 \tabularnewline
38.6002489990903 \tabularnewline
63.0852945156827 \tabularnewline
-9.71565472599102 \tabularnewline
-28.8868533166945 \tabularnewline
-20.5473238072305 \tabularnewline
-42.3786440785772 \tabularnewline
9.06210622682762 \tabularnewline
7.22764852135031 \tabularnewline
3.6810790337053 \tabularnewline
19.4226858949464 \tabularnewline
-16.1266593439243 \tabularnewline
98.8699564442992 \tabularnewline
-36.6258924746581 \tabularnewline
-13.4476113428822 \tabularnewline
41.8603833496451 \tabularnewline
38.0211409056186 \tabularnewline
23.4126349952751 \tabularnewline
-45.0481785806668 \tabularnewline
-35.6274890935836 \tabularnewline
12.6284805704117 \tabularnewline
65.3157095323229 \tabularnewline
-65.6446591476875 \tabularnewline
10.5133604597465 \tabularnewline
56.6824548433617 \tabularnewline
43.2087848493126 \tabularnewline
-35.5538893299337 \tabularnewline
-84.7568301241387 \tabularnewline
-18.9346714433155 \tabularnewline
52.2212418023078 \tabularnewline
27.6671289635803 \tabularnewline
-16.8462689226332 \tabularnewline
9.70482078829293 \tabularnewline
-57.1495058408181 \tabularnewline
32.5675916433793 \tabularnewline
-10.6880601365869 \tabularnewline
-1.54894460700751 \tabularnewline
73.4851565542768 \tabularnewline
-41.0027921930313 \tabularnewline
18.0572318798463 \tabularnewline
2.86672358318304 \tabularnewline
17.4571281735184 \tabularnewline
-28.8896722599033 \tabularnewline
1.81504649461652 \tabularnewline
-56.9428058929578 \tabularnewline
-46.8324559514357 \tabularnewline
-28.6762523680829 \tabularnewline
47.3411025178685 \tabularnewline
47.4704730929327 \tabularnewline
108.547795065956 \tabularnewline
-34.9618494124655 \tabularnewline
116.48589722398 \tabularnewline
-21.2193492574044 \tabularnewline
-43.8042614795223 \tabularnewline
58.8464964290146 \tabularnewline
10.6695453608548 \tabularnewline
-65.1633153246355 \tabularnewline
-42.0617381692542 \tabularnewline
-64.4413547094991 \tabularnewline
-19.638174299647 \tabularnewline
24.750108065081 \tabularnewline
-12.3153072769743 \tabularnewline
63.9283973159614 \tabularnewline
-13.248885372484 \tabularnewline
\hline
\end{tabular}
%Source: https://freestatistics.org/blog/index.php?pk=203740&T=2

[TABLE]
[ROW][C]Estimated ARIMA Residuals[/C][/ROW]
[ROW][C]Value[/C][/ROW]
[ROW][C]0.0409999680813096[/C][/ROW]
[ROW][C]-1.60279964492074[/C][/ROW]
[ROW][C]8.82447361885632[/C][/ROW]
[ROW][C]-4.94761107607199[/C][/ROW]
[ROW][C]1.31997600692915[/C][/ROW]
[ROW][C]-6.93109951038768[/C][/ROW]
[ROW][C]6.27136180014695[/C][/ROW]
[ROW][C]-8.36703299365229[/C][/ROW]
[ROW][C]2.98605207385911[/C][/ROW]
[ROW][C]-5.87206455393686[/C][/ROW]
[ROW][C]-3.20040797256286[/C][/ROW]
[ROW][C]12.4829198191867[/C][/ROW]
[ROW][C]9.10285540951901[/C][/ROW]
[ROW][C]13.6000915842102[/C][/ROW]
[ROW][C]1.86366474143316[/C][/ROW]
[ROW][C]-23.5070027088168[/C][/ROW]
[ROW][C]-6.70238990007883[/C][/ROW]
[ROW][C]6.87539556988858[/C][/ROW]
[ROW][C]12.1817350624816[/C][/ROW]
[ROW][C]10.9183658695789[/C][/ROW]
[ROW][C]0.447103064988039[/C][/ROW]
[ROW][C]-3.6907994307447[/C][/ROW]
[ROW][C]16.5017363786339[/C][/ROW]
[ROW][C]20.3042171889317[/C][/ROW]
[ROW][C]-6.82647472081156[/C][/ROW]
[ROW][C]-20.4409868529086[/C][/ROW]
[ROW][C]-19.3640557615179[/C][/ROW]
[ROW][C]34.7666198213034[/C][/ROW]
[ROW][C]21.388538488087[/C][/ROW]
[ROW][C]-12.2460780522811[/C][/ROW]
[ROW][C]20.0159726246018[/C][/ROW]
[ROW][C]40.8839859436008[/C][/ROW]
[ROW][C]3.51215748399611[/C][/ROW]
[ROW][C]-27.7911146464848[/C][/ROW]
[ROW][C]11.5997627719312[/C][/ROW]
[ROW][C]21.4364584811034[/C][/ROW]
[ROW][C]25.6199270543078[/C][/ROW]
[ROW][C]-28.1464048511635[/C][/ROW]
[ROW][C]7.12314852121743[/C][/ROW]
[ROW][C]-36.0093125542921[/C][/ROW]
[ROW][C]-2.18522517610963[/C][/ROW]
[ROW][C]-44.0119266532121[/C][/ROW]
[ROW][C]27.1626894864584[/C][/ROW]
[ROW][C]5.10238771018833[/C][/ROW]
[ROW][C]-1.85619561760742[/C][/ROW]
[ROW][C]-25.0977202382128[/C][/ROW]
[ROW][C]-9.19056569421521[/C][/ROW]
[ROW][C]-34.2955325134522[/C][/ROW]
[ROW][C]9.36661436270424[/C][/ROW]
[ROW][C]19.4677592586415[/C][/ROW]
[ROW][C]17.291868924285[/C][/ROW]
[ROW][C]-16.1276834623894[/C][/ROW]
[ROW][C]-0.909861823073184[/C][/ROW]
[ROW][C]37.9527938524243[/C][/ROW]
[ROW][C]31.0860458921549[/C][/ROW]
[ROW][C]38.6002489990903[/C][/ROW]
[ROW][C]63.0852945156827[/C][/ROW]
[ROW][C]-9.71565472599102[/C][/ROW]
[ROW][C]-28.8868533166945[/C][/ROW]
[ROW][C]-20.5473238072305[/C][/ROW]
[ROW][C]-42.3786440785772[/C][/ROW]
[ROW][C]9.06210622682762[/C][/ROW]
[ROW][C]7.22764852135031[/C][/ROW]
[ROW][C]3.6810790337053[/C][/ROW]
[ROW][C]19.4226858949464[/C][/ROW]
[ROW][C]-16.1266593439243[/C][/ROW]
[ROW][C]98.8699564442992[/C][/ROW]
[ROW][C]-36.6258924746581[/C][/ROW]
[ROW][C]-13.4476113428822[/C][/ROW]
[ROW][C]41.8603833496451[/C][/ROW]
[ROW][C]38.0211409056186[/C][/ROW]
[ROW][C]23.4126349952751[/C][/ROW]
[ROW][C]-45.0481785806668[/C][/ROW]
[ROW][C]-35.6274890935836[/C][/ROW]
[ROW][C]12.6284805704117[/C][/ROW]
[ROW][C]65.3157095323229[/C][/ROW]
[ROW][C]-65.6446591476875[/C][/ROW]
[ROW][C]10.5133604597465[/C][/ROW]
[ROW][C]56.6824548433617[/C][/ROW]
[ROW][C]43.2087848493126[/C][/ROW]
[ROW][C]-35.5538893299337[/C][/ROW]
[ROW][C]-84.7568301241387[/C][/ROW]
[ROW][C]-18.9346714433155[/C][/ROW]
[ROW][C]52.2212418023078[/C][/ROW]
[ROW][C]27.6671289635803[/C][/ROW]
[ROW][C]-16.8462689226332[/C][/ROW]
[ROW][C]9.70482078829293[/C][/ROW]
[ROW][C]-57.1495058408181[/C][/ROW]
[ROW][C]32.5675916433793[/C][/ROW]
[ROW][C]-10.6880601365869[/C][/ROW]
[ROW][C]-1.54894460700751[/C][/ROW]
[ROW][C]73.4851565542768[/C][/ROW]
[ROW][C]-41.0027921930313[/C][/ROW]
[ROW][C]18.0572318798463[/C][/ROW]
[ROW][C]2.86672358318304[/C][/ROW]
[ROW][C]17.4571281735184[/C][/ROW]
[ROW][C]-28.8896722599033[/C][/ROW]
[ROW][C]1.81504649461652[/C][/ROW]
[ROW][C]-56.9428058929578[/C][/ROW]
[ROW][C]-46.8324559514357[/C][/ROW]
[ROW][C]-28.6762523680829[/C][/ROW]
[ROW][C]47.3411025178685[/C][/ROW]
[ROW][C]47.4704730929327[/C][/ROW]
[ROW][C]108.547795065956[/C][/ROW]
[ROW][C]-34.9618494124655[/C][/ROW]
[ROW][C]116.48589722398[/C][/ROW]
[ROW][C]-21.2193492574044[/C][/ROW]
[ROW][C]-43.8042614795223[/C][/ROW]
[ROW][C]58.8464964290146[/C][/ROW]
[ROW][C]10.6695453608548[/C][/ROW]
[ROW][C]-65.1633153246355[/C][/ROW]
[ROW][C]-42.0617381692542[/C][/ROW]
[ROW][C]-64.4413547094991[/C][/ROW]
[ROW][C]-19.638174299647[/C][/ROW]
[ROW][C]24.750108065081[/C][/ROW]
[ROW][C]-12.3153072769743[/C][/ROW]
[ROW][C]63.9283973159614[/C][/ROW]
[ROW][C]-13.248885372484[/C][/ROW]
[/TABLE]
Source: https://freestatistics.org/blog/index.php?pk=203740&T=2

Globally Unique Identifier (entire table): ba.freestatistics.org/blog/index.php?pk=203740&T=2

As an alternative you can also use a QR Code:  

The GUIDs for individual cells are displayed in the table below:

Estimated ARIMA Residuals
Value
0.0409999680813096
-1.60279964492074
8.82447361885632
-4.94761107607199
1.31997600692915
-6.93109951038768
6.27136180014695
-8.36703299365229
2.98605207385911
-5.87206455393686
-3.20040797256286
12.4829198191867
9.10285540951901
13.6000915842102
1.86366474143316
-23.5070027088168
-6.70238990007883
6.87539556988858
12.1817350624816
10.9183658695789
0.447103064988039
-3.6907994307447
16.5017363786339
20.3042171889317
-6.82647472081156
-20.4409868529086
-19.3640557615179
34.7666198213034
21.388538488087
-12.2460780522811
20.0159726246018
40.8839859436008
3.51215748399611
-27.7911146464848
11.5997627719312
21.4364584811034
25.6199270543078
-28.1464048511635
7.12314852121743
-36.0093125542921
-2.18522517610963
-44.0119266532121
27.1626894864584
5.10238771018833
-1.85619561760742
-25.0977202382128
-9.19056569421521
-34.2955325134522
9.36661436270424
19.4677592586415
17.291868924285
-16.1276834623894
-0.909861823073184
37.9527938524243
31.0860458921549
38.6002489990903
63.0852945156827
-9.71565472599102
-28.8868533166945
-20.5473238072305
-42.3786440785772
9.06210622682762
7.22764852135031
3.6810790337053
19.4226858949464
-16.1266593439243
98.8699564442992
-36.6258924746581
-13.4476113428822
41.8603833496451
38.0211409056186
23.4126349952751
-45.0481785806668
-35.6274890935836
12.6284805704117
65.3157095323229
-65.6446591476875
10.5133604597465
56.6824548433617
43.2087848493126
-35.5538893299337
-84.7568301241387
-18.9346714433155
52.2212418023078
27.6671289635803
-16.8462689226332
9.70482078829293
-57.1495058408181
32.5675916433793
-10.6880601365869
-1.54894460700751
73.4851565542768
-41.0027921930313
18.0572318798463
2.86672358318304
17.4571281735184
-28.8896722599033
1.81504649461652
-56.9428058929578
-46.8324559514357
-28.6762523680829
47.3411025178685
47.4704730929327
108.547795065956
-34.9618494124655
116.48589722398
-21.2193492574044
-43.8042614795223
58.8464964290146
10.6695453608548
-65.1633153246355
-42.0617381692542
-64.4413547094991
-19.638174299647
24.750108065081
-12.3153072769743
63.9283973159614
-13.248885372484


Parameters (Session):
par1 = FALSE ; par2 = 1 ; par3 = 1 ; par4 = 0 ; par5 = 12 ; par6 = 3 ; par7 = 1 ; par8 = 1 ; par9 = 1 ;
Parameters (R input):
par1 = FALSE ; par2 = 1 ; par3 = 1 ; par4 = 0 ; par5 = 12 ; par6 = 3 ; par7 = 1 ; par8 = 1 ; par9 = 1 ;
R code (references can be found in the software module):
library(lattice)
if (par1 == 'TRUE') par1 <- TRUE
if (par1 == 'FALSE') par1 <- FALSE
par2 <- as.numeric(par2) #Box-Cox lambda transformation parameter
par3 <- as.numeric(par3) #degree of non-seasonal differencing
par4 <- as.numeric(par4) #degree of seasonal differencing
par5 <- as.numeric(par5) #seasonal period
par6 <- as.numeric(par6) #degree (p) of the non-seasonal AR(p) polynomial
par7 <- as.numeric(par7) #degree (q) of the non-seasonal MA(q) polynomial
par8 <- as.numeric(par8) #degree (P) of the seasonal AR(P) polynomial
par9 <- as.numeric(par9) #degree (Q) of the seasonal MA(Q) polynomial
armaGR <- function(arima.out, names, n){
try1 <- arima.out$coef
try2 <- sqrt(diag(arima.out$var.coef))
try.data.frame <- data.frame(matrix(NA,ncol=4,nrow=length(names)))
dimnames(try.data.frame) <- list(names,c('coef','std','tstat','pv'))
try.data.frame[,1] <- try1
for(i in 1:length(try2)) try.data.frame[which(rownames(try.data.frame)==names(try2)[i]),2] <- try2[i]
try.data.frame[,3] <- try.data.frame[,1] / try.data.frame[,2]
try.data.frame[,4] <- round((1-pt(abs(try.data.frame[,3]),df=n-(length(try2)+1)))*2,5)
vector <- rep(NA,length(names))
vector[is.na(try.data.frame[,4])] <- 0
maxi <- which.max(try.data.frame[,4])
continue <- max(try.data.frame[,4],na.rm=TRUE) > .05
vector[maxi] <- 0
list(summary=try.data.frame,next.vector=vector,continue=continue)
}
arimaSelect <- function(series, order=c(13,0,0), seasonal=list(order=c(2,0,0),period=12), include.mean=F){
nrc <- order[1]+order[3]+seasonal$order[1]+seasonal$order[3]
coeff <- matrix(NA, nrow=nrc*2, ncol=nrc)
pval <- matrix(NA, nrow=nrc*2, ncol=nrc)
mylist <- rep(list(NULL), nrc)
names <- NULL
if(order[1] > 0) names <- paste('ar',1:order[1],sep='')
if(order[3] > 0) names <- c( names , paste('ma',1:order[3],sep='') )
if(seasonal$order[1] > 0) names <- c(names, paste('sar',1:seasonal$order[1],sep=''))
if(seasonal$order[3] > 0) names <- c(names, paste('sma',1:seasonal$order[3],sep=''))
arima.out <- arima(series, order=order, seasonal=seasonal, include.mean=include.mean, method='ML')
mylist[[1]] <- arima.out
last.arma <- armaGR(arima.out, names, length(series))
mystop <- FALSE
i <- 1
coeff[i,] <- last.arma[[1]][,1]
pval [i,] <- last.arma[[1]][,4]
i <- 2
aic <- arima.out$aic
while(!mystop){
mylist[[i]] <- arima.out
arima.out <- arima(series, order=order, seasonal=seasonal, include.mean=include.mean, method='ML', fixed=last.arma$next.vector)
aic <- c(aic, arima.out$aic)
last.arma <- armaGR(arima.out, names, length(series))
mystop <- !last.arma$continue
coeff[i,] <- last.arma[[1]][,1]
pval [i,] <- last.arma[[1]][,4]
i <- i+1
}
list(coeff, pval, mylist, aic=aic)
}
arimaSelectplot <- function(arimaSelect.out,noms,choix){
noms <- names(arimaSelect.out[[3]][[1]]$coef)
coeff <- arimaSelect.out[[1]]
k <- min(which(is.na(coeff[,1])))-1
coeff <- coeff[1:k,]
pval <- arimaSelect.out[[2]][1:k,]
aic <- arimaSelect.out$aic[1:k]
coeff[coeff==0] <- NA
n <- ncol(coeff)
if(missing(choix)) choix <- k
layout(matrix(c(1,1,1,2,
3,3,3,2,
3,3,3,4,
5,6,7,7),nr=4),
widths=c(10,35,45,15),
heights=c(30,30,15,15))
couleurs <- rainbow(75)[1:50]#(50)
ticks <- pretty(coeff)
par(mar=c(1,1,3,1))
plot(aic,k:1-.5,type='o',pch=21,bg='blue',cex=2,axes=F,lty=2,xpd=NA)
points(aic[choix],k-choix+.5,pch=21,cex=4,bg=2,xpd=NA)
title('aic',line=2)
par(mar=c(3,0,0,0))
plot(0,axes=F,xlab='',ylab='',xlim=range(ticks),ylim=c(.1,1))
rect(xleft = min(ticks) + (0:49)/50*(max(ticks)-min(ticks)),
xright = min(ticks) + (1:50)/50*(max(ticks)-min(ticks)),
ytop = rep(1,50),
ybottom= rep(0,50),col=couleurs,border=NA)
axis(1,ticks)
rect(xleft=min(ticks),xright=max(ticks),ytop=1,ybottom=0)
text(mean(coeff,na.rm=T),.5,'coefficients',cex=2,font=2)
par(mar=c(1,1,3,1))
image(1:n,1:k,t(coeff[k:1,]),axes=F,col=couleurs,zlim=range(ticks))
for(i in 1:n) for(j in 1:k) if(!is.na(coeff[j,i])) {
if(pval[j,i]<.01) symb = 'green'
else if( (pval[j,i]<.05) & (pval[j,i]>=.01)) symb = 'orange'
else if( (pval[j,i]<.1) & (pval[j,i]>=.05)) symb = 'red'
else symb = 'black'
polygon(c(i+.5 ,i+.2 ,i+.5 ,i+.5),
c(k-j+0.5,k-j+0.5,k-j+0.8,k-j+0.5),
col=symb)
if(j==choix) {
rect(xleft=i-.5,
xright=i+.5,
ybottom=k-j+1.5,
ytop=k-j+.5,
lwd=4)
text(i,
k-j+1,
round(coeff[j,i],2),
cex=1.2,
font=2)
}
else{
rect(xleft=i-.5,xright=i+.5,ybottom=k-j+1.5,ytop=k-j+.5)
text(i,k-j+1,round(coeff[j,i],2),cex=1.2,font=1)
}
}
axis(3,1:n,noms)
par(mar=c(0.5,0,0,0.5))
plot(0,axes=F,xlab='',ylab='',type='n',xlim=c(0,8),ylim=c(-.2,.8))
cols <- c('green','orange','red','black')
niv <- c('0','0.01','0.05','0.1')
for(i in 0:3){
polygon(c(1+2*i ,1+2*i ,1+2*i-.5 ,1+2*i),
c(.4 ,.7 , .4 , .4),
col=cols[i+1])
text(2*i,0.5,niv[i+1],cex=1.5)
}
text(8,.5,1,cex=1.5)
text(4,0,'p-value',cex=2)
box()
residus <- arimaSelect.out[[3]][[choix]]$res
par(mar=c(1,2,4,1))
acf(residus,main='')
title('acf',line=.5)
par(mar=c(1,2,4,1))
pacf(residus,main='')
title('pacf',line=.5)
par(mar=c(2,2,4,1))
qqnorm(residus,main='')
title('qq-norm',line=.5)
qqline(residus)
residus
}
if (par2 == 0) x <- log(x)
if (par2 != 0) x <- x^par2
(selection <- arimaSelect(x, order=c(par6,par3,par7), seasonal=list(order=c(par8,par4,par9), period=par5)))
bitmap(file='test1.png')
resid <- arimaSelectplot(selection)
dev.off()
resid
bitmap(file='test2.png')
acf(resid,length(resid)/2, main='Residual Autocorrelation Function')
dev.off()
bitmap(file='test3.png')
pacf(resid,length(resid)/2, main='Residual Partial Autocorrelation Function')
dev.off()
bitmap(file='test4.png')
cpgram(resid, main='Residual Cumulative Periodogram')
dev.off()
bitmap(file='test5.png')
hist(resid, main='Residual Histogram', xlab='values of Residuals')
dev.off()
bitmap(file='test6.png')
densityplot(~resid,col='black',main='Residual Density Plot', xlab='values of Residuals')
dev.off()
bitmap(file='test7.png')
qqnorm(resid, main='Residual Normal Q-Q Plot')
qqline(resid)
dev.off()
ncols <- length(selection[[1]][1,])
nrows <- length(selection[[2]][,1])-1
load(file='createtable')
a<-table.start()
a<-table.row.start(a)
a<-table.element(a,'ARIMA Parameter Estimation and Backward Selection', ncols+1,TRUE)
a<-table.row.end(a)
a<-table.row.start(a)
a<-table.element(a,'Iteration', header=TRUE)
for (i in 1:ncols) {
a<-table.element(a,names(selection[[3]][[1]]$coef)[i],header=TRUE)
}
a<-table.row.end(a)
for (j in 1:nrows) {
a<-table.row.start(a)
mydum <- 'Estimates ('
mydum <- paste(mydum,j)
mydum <- paste(mydum,')')
a<-table.element(a,mydum, header=TRUE)
for (i in 1:ncols) {
a<-table.element(a,round(selection[[1]][j,i],4))
}
a<-table.row.end(a)
a<-table.row.start(a)
a<-table.element(a,'(p-val)', header=TRUE)
for (i in 1:ncols) {
mydum <- '('
mydum <- paste(mydum,round(selection[[2]][j,i],4),sep='')
mydum <- paste(mydum,')')
a<-table.element(a,mydum)
}
a<-table.row.end(a)
}
a<-table.end(a)
table.save(a,file='mytable.tab')
a<-table.start()
a<-table.row.start(a)
a<-table.element(a,'Estimated ARIMA Residuals', 1,TRUE)
a<-table.row.end(a)
a<-table.row.start(a)
a<-table.element(a,'Value', 1,TRUE)
a<-table.row.end(a)
for (i in (par4*par5+par3):length(resid)) {
a<-table.row.start(a)
a<-table.element(a,resid[i])
a<-table.row.end(a)
}
a<-table.end(a)
table.save(a,file='mytable1.tab')