Free Statistics

of Irreproducible Research!

Author's title

Author*Unverified author*
R Software Module--
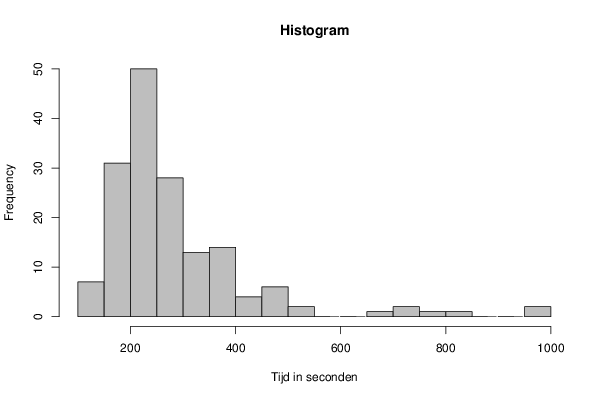
Title produced by softwareHistogram
Date of computationFri, 21 Dec 2012 09:09:46 -0500
Cite this page as followsStatistical Computations at FreeStatistics.org, Office for Research Development and Education, URL https://freestatistics.org/blog/index.php?v=date/2012/Dec/21/t1356098998cqikur02pboz2xr.htm/, Retrieved Thu, 28 Mar 2024 23:18:09 +0000
Statistical Computations at FreeStatistics.org, Office for Research Development and Education, URL https://freestatistics.org/blog/index.php?pk=203688, Retrieved Thu, 28 Mar 2024 23:18:09 +0000
QR Codes:

Original text written by user:
IsPrivate?No (this computation is public)
User-defined keywords
Estimated Impact48
Family? (F = Feedback message, R = changed R code, M = changed R Module, P = changed Parameters, D = changed Data)
-     [Histogram] [Paper deel 1 Hist...] [2011-12-18 13:25:40] [1321c14511baa35aebbc5dda661708fe]
- RM      [Histogram] [] [2012-12-21 14:09:46] [d41d8cd98f00b204e9800998ecf8427e] [Current]
Feedback Forum

Post a new message
Dataseries X:
186.59
244.665
248.18
253.568
171.242
413.971
216.89
227.901
259.823
148.438
241.013
206.248
108.908
267.952
314.219
235.115
203.027
365.415
350.933
263.304
738.751
959.073
483.828
213.016
177.341
352.622
352.622
217.307
236.184
215.701
228.383
485.625
252.502
342.515
196.931
365.315
316.664
313.523
188.124
184.083
362.962
170.161
167.484
211.752
276.469
182.097
266.904
235.328
329.45
258.118
952.515
247.141
498.726
313.308
420.188
231.156
227.844
204.385
216.563
207.19
232.417
203.109
221.07
254.623
108.981
229.417
476.376
221.91
158.946
295.746
187.976
283.76
705.401
178.69
232.635
245.185
186.03
181.142
228.478
491.849
506.461
182.828
263.654
253.718
480.937
209.894
655.92
223.408
103.138
255.664
184.661
372.945
758.6
256.445
204.868
197.384
245.311
301.707
501.478
278.731
205.92
177.14
139.753
366.46
435.522
239.906
178.722
340.04
236.948
221.152
263.303
222.814
317.99
149.593
221.983
201.551
266.901
185.218
347.536
395.593
238.217
254.697
157.584
807.302
252.391
189.194
267.834
173.15
267.633
283.284
209.475
135.135
285.012
178.495
256.852
301.828
158.403
355.963
364.117
233.203
257.634
208.57
212.503
251.059
276.803
198.339
301.018
369.761
162.768
199.968
406.676
364.156
202.391
319.491
185.546
243.559
220.928
193.714
372.943
163.822
217.566
232.527


Summary of computational transaction
Raw Inputview raw input (R code)
Raw Outputview raw output of R engine
Computing time1 seconds
R Server'Gertrude Mary Cox' @ cox.wessa.net

\begin{tabular}{lllllllll}
\hline
Summary of computational transaction \tabularnewline
Raw Input & view raw input (R code)  \tabularnewline
Raw Output & view raw output of R engine  \tabularnewline
Computing time & 1 seconds \tabularnewline
R Server & 'Gertrude Mary Cox' @ cox.wessa.net \tabularnewline
\hline
\end{tabular}
%Source: https://freestatistics.org/blog/index.php?pk=203688&T=0

[TABLE]
[ROW][C]Summary of computational transaction[/C][/ROW]
[ROW][C]Raw Input[/C][C]view raw input (R code) [/C][/ROW]
[ROW][C]Raw Output[/C][C]view raw output of R engine [/C][/ROW]
[ROW][C]Computing time[/C][C]1 seconds[/C][/ROW]
[ROW][C]R Server[/C][C]'Gertrude Mary Cox' @ cox.wessa.net[/C][/ROW]
[/TABLE]
Source: https://freestatistics.org/blog/index.php?pk=203688&T=0

Globally Unique Identifier (entire table): ba.freestatistics.org/blog/index.php?pk=203688&T=0

As an alternative you can also use a QR Code:  

The GUIDs for individual cells are displayed in the table below:

Summary of computational transaction
Raw Inputview raw input (R code)
Raw Outputview raw output of R engine
Computing time1 seconds
R Server'Gertrude Mary Cox' @ cox.wessa.net


Frequency Table (Histogram)
BinsMidpointAbs. FrequencyRel. FrequencyCumul. Rel. Freq.Density
[100,150[12570.043210.043210.000864
[150,200[175310.1913580.2345680.003827
[200,250[225500.3086420.543210.006173
[250,300[275280.172840.7160490.003457
[300,350[325130.0802470.7962960.001605
[350,400[375140.086420.8827160.001728
[400,450[42540.0246910.9074070.000494
[450,500[47560.0370370.9444440.000741
[500,550[52520.0123460.956790.000247
[550,600[575000.956790
[600,650[625000.956790
[650,700[67510.0061730.9629630.000123
[700,750[72520.0123460.9753090.000247
[750,800[77510.0061730.9814810.000123
[800,850[82510.0061730.9876540.000123
[850,900[875000.9876540
[900,950[925000.9876540
[950,1000]97520.01234610.000247

\begin{tabular}{lllllllll}
\hline
Frequency Table (Histogram) \tabularnewline
Bins & Midpoint & Abs. Frequency & Rel. Frequency & Cumul. Rel. Freq. & Density \tabularnewline
[100,150[ & 125 & 7 & 0.04321 & 0.04321 & 0.000864 \tabularnewline
[150,200[ & 175 & 31 & 0.191358 & 0.234568 & 0.003827 \tabularnewline
[200,250[ & 225 & 50 & 0.308642 & 0.54321 & 0.006173 \tabularnewline
[250,300[ & 275 & 28 & 0.17284 & 0.716049 & 0.003457 \tabularnewline
[300,350[ & 325 & 13 & 0.080247 & 0.796296 & 0.001605 \tabularnewline
[350,400[ & 375 & 14 & 0.08642 & 0.882716 & 0.001728 \tabularnewline
[400,450[ & 425 & 4 & 0.024691 & 0.907407 & 0.000494 \tabularnewline
[450,500[ & 475 & 6 & 0.037037 & 0.944444 & 0.000741 \tabularnewline
[500,550[ & 525 & 2 & 0.012346 & 0.95679 & 0.000247 \tabularnewline
[550,600[ & 575 & 0 & 0 & 0.95679 & 0 \tabularnewline
[600,650[ & 625 & 0 & 0 & 0.95679 & 0 \tabularnewline
[650,700[ & 675 & 1 & 0.006173 & 0.962963 & 0.000123 \tabularnewline
[700,750[ & 725 & 2 & 0.012346 & 0.975309 & 0.000247 \tabularnewline
[750,800[ & 775 & 1 & 0.006173 & 0.981481 & 0.000123 \tabularnewline
[800,850[ & 825 & 1 & 0.006173 & 0.987654 & 0.000123 \tabularnewline
[850,900[ & 875 & 0 & 0 & 0.987654 & 0 \tabularnewline
[900,950[ & 925 & 0 & 0 & 0.987654 & 0 \tabularnewline
[950,1000] & 975 & 2 & 0.012346 & 1 & 0.000247 \tabularnewline
\hline
\end{tabular}
%Source: https://freestatistics.org/blog/index.php?pk=203688&T=1

[TABLE]
[ROW][C]Frequency Table (Histogram)[/C][/ROW]
[ROW][C]Bins[/C][C]Midpoint[/C][C]Abs. Frequency[/C][C]Rel. Frequency[/C][C]Cumul. Rel. Freq.[/C][C]Density[/C][/ROW]
[ROW][C][100,150[[/C][C]125[/C][C]7[/C][C]0.04321[/C][C]0.04321[/C][C]0.000864[/C][/ROW]
[ROW][C][150,200[[/C][C]175[/C][C]31[/C][C]0.191358[/C][C]0.234568[/C][C]0.003827[/C][/ROW]
[ROW][C][200,250[[/C][C]225[/C][C]50[/C][C]0.308642[/C][C]0.54321[/C][C]0.006173[/C][/ROW]
[ROW][C][250,300[[/C][C]275[/C][C]28[/C][C]0.17284[/C][C]0.716049[/C][C]0.003457[/C][/ROW]
[ROW][C][300,350[[/C][C]325[/C][C]13[/C][C]0.080247[/C][C]0.796296[/C][C]0.001605[/C][/ROW]
[ROW][C][350,400[[/C][C]375[/C][C]14[/C][C]0.08642[/C][C]0.882716[/C][C]0.001728[/C][/ROW]
[ROW][C][400,450[[/C][C]425[/C][C]4[/C][C]0.024691[/C][C]0.907407[/C][C]0.000494[/C][/ROW]
[ROW][C][450,500[[/C][C]475[/C][C]6[/C][C]0.037037[/C][C]0.944444[/C][C]0.000741[/C][/ROW]
[ROW][C][500,550[[/C][C]525[/C][C]2[/C][C]0.012346[/C][C]0.95679[/C][C]0.000247[/C][/ROW]
[ROW][C][550,600[[/C][C]575[/C][C]0[/C][C]0[/C][C]0.95679[/C][C]0[/C][/ROW]
[ROW][C][600,650[[/C][C]625[/C][C]0[/C][C]0[/C][C]0.95679[/C][C]0[/C][/ROW]
[ROW][C][650,700[[/C][C]675[/C][C]1[/C][C]0.006173[/C][C]0.962963[/C][C]0.000123[/C][/ROW]
[ROW][C][700,750[[/C][C]725[/C][C]2[/C][C]0.012346[/C][C]0.975309[/C][C]0.000247[/C][/ROW]
[ROW][C][750,800[[/C][C]775[/C][C]1[/C][C]0.006173[/C][C]0.981481[/C][C]0.000123[/C][/ROW]
[ROW][C][800,850[[/C][C]825[/C][C]1[/C][C]0.006173[/C][C]0.987654[/C][C]0.000123[/C][/ROW]
[ROW][C][850,900[[/C][C]875[/C][C]0[/C][C]0[/C][C]0.987654[/C][C]0[/C][/ROW]
[ROW][C][900,950[[/C][C]925[/C][C]0[/C][C]0[/C][C]0.987654[/C][C]0[/C][/ROW]
[ROW][C][950,1000][/C][C]975[/C][C]2[/C][C]0.012346[/C][C]1[/C][C]0.000247[/C][/ROW]
[/TABLE]
Source: https://freestatistics.org/blog/index.php?pk=203688&T=1

Globally Unique Identifier (entire table): ba.freestatistics.org/blog/index.php?pk=203688&T=1

As an alternative you can also use a QR Code:  

The GUIDs for individual cells are displayed in the table below:

Frequency Table (Histogram)
BinsMidpointAbs. FrequencyRel. FrequencyCumul. Rel. Freq.Density
[100,150[12570.043210.043210.000864
[150,200[175310.1913580.2345680.003827
[200,250[225500.3086420.543210.006173
[250,300[275280.172840.7160490.003457
[300,350[325130.0802470.7962960.001605
[350,400[375140.086420.8827160.001728
[400,450[42540.0246910.9074070.000494
[450,500[47560.0370370.9444440.000741
[500,550[52520.0123460.956790.000247
[550,600[575000.956790
[600,650[625000.956790
[650,700[67510.0061730.9629630.000123
[700,750[72520.0123460.9753090.000247
[750,800[77510.0061730.9814810.000123
[800,850[82510.0061730.9876540.000123
[850,900[875000.9876540
[900,950[925000.9876540
[950,1000]97520.01234610.000247


Parameters (Session):
par1 = 30 ; par2 = grey ; par3 = FALSE ; par4 = Unknown ;
Parameters (R input):
par1 = 30 ; par2 = grey ; par3 = FALSE ; par4 = Unknown ; par5 = ; par6 = ; par7 = ; par8 = ; par9 = ; par10 = ; par11 = ; par12 = ; par13 = ; par14 = ; par15 = ; par16 = ; par17 = ; par18 = ; par19 = ; par20 = ;
R code (references can be found in the software module):
par1 <- as.numeric(par1)
if (par3 == 'TRUE') par3 <- TRUE
if (par3 == 'FALSE') par3 <- FALSE
if (par4 == 'Unknown') par1 <- as.numeric(par1)
if (par4 == 'Interval/Ratio') par1 <- as.numeric(par1)
if (par4 == '3-point Likert') par1 <- c(1:3 - 0.5, 3.5)
if (par4 == '4-point Likert') par1 <- c(1:4 - 0.5, 4.5)
if (par4 == '5-point Likert') par1 <- c(1:5 - 0.5, 5.5)
if (par4 == '6-point Likert') par1 <- c(1:6 - 0.5, 6.5)
if (par4 == '7-point Likert') par1 <- c(1:7 - 0.5, 7.5)
if (par4 == '8-point Likert') par1 <- c(1:8 - 0.5, 8.5)
if (par4 == '9-point Likert') par1 <- c(1:9 - 0.5, 9.5)
if (par4 == '10-point Likert') par1 <- c(1:10 - 0.5, 10.5)
bitmap(file='test1.png')
if(is.numeric(x[1])) {
if (is.na(par1)) {
myhist<-hist(x,col=par2,main=main,xlab=xlab,right=par3)
} else {
if (par1 < 0) par1 <- 3
if (par1 > 50) par1 <- 50
myhist<-hist(x,breaks=par1,col=par2,main=main,xlab=xlab,right=par3)
}
} else {
plot(mytab <- table(x),col=par2,main='Frequency Plot',xlab=xlab,ylab='Absolute Frequency')
}
dev.off()
if(is.numeric(x[1])) {
myhist
n <- length(x)
load(file='createtable')
a<-table.start()
a<-table.row.start(a)
a<-table.element(a,hyperlink('histogram.htm','Frequency Table (Histogram)',''),6,TRUE)
a<-table.row.end(a)
a<-table.row.start(a)
a<-table.element(a,'Bins',header=TRUE)
a<-table.element(a,'Midpoint',header=TRUE)
a<-table.element(a,'Abs. Frequency',header=TRUE)
a<-table.element(a,'Rel. Frequency',header=TRUE)
a<-table.element(a,'Cumul. Rel. Freq.',header=TRUE)
a<-table.element(a,'Density',header=TRUE)
a<-table.row.end(a)
crf <- 0
if (par3 == FALSE) mybracket <- '[' else mybracket <- ']'
mynumrows <- (length(myhist$breaks)-1)
for (i in 1:mynumrows) {
a<-table.row.start(a)
if (i == 1)
dum <- paste('[',myhist$breaks[i],sep='')
else
dum <- paste(mybracket,myhist$breaks[i],sep='')
dum <- paste(dum,myhist$breaks[i+1],sep=',')
if (i==mynumrows)
dum <- paste(dum,']',sep='')
else
dum <- paste(dum,mybracket,sep='')
a<-table.element(a,dum,header=TRUE)
a<-table.element(a,myhist$mids[i])
a<-table.element(a,myhist$counts[i])
rf <- myhist$counts[i]/n
crf <- crf + rf
a<-table.element(a,round(rf,6))
a<-table.element(a,round(crf,6))
a<-table.element(a,round(myhist$density[i],6))
a<-table.row.end(a)
}
a<-table.end(a)
table.save(a,file='mytable.tab')
} else {
mytab
reltab <- mytab / sum(mytab)
n <- length(mytab)
load(file='createtable')
a<-table.start()
a<-table.row.start(a)
a<-table.element(a,'Frequency Table (Categorical Data)',3,TRUE)
a<-table.row.end(a)
a<-table.row.start(a)
a<-table.element(a,'Category',header=TRUE)
a<-table.element(a,'Abs. Frequency',header=TRUE)
a<-table.element(a,'Rel. Frequency',header=TRUE)
a<-table.row.end(a)
for (i in 1:n) {
a<-table.row.start(a)
a<-table.element(a,labels(mytab)$x[i],header=TRUE)
a<-table.element(a,mytab[i])
a<-table.element(a,round(reltab[i],4))
a<-table.row.end(a)
}
a<-table.end(a)
table.save(a,file='mytable1.tab')
}