| Multiple Linear Regression - Estimated Regression Equation |
| Bachelor[t] = + 574581.699810098 + 70010.4214182505Populatie[t] -94.7557257571973Bevolkingsdicht[t] -94869.4011716203Werkloosheid[t] -280628.86326009Land[t] + e[t] |
| Multiple Linear Regression - Ordinary Least Squares | |||||
| Variable | Parameter | S.D. | T-STAT H0: parameter = 0 | 2-tail p-value | 1-tail p-value |
| (Intercept) | 574581.699810098 | 360351.533385 | 1.5945 | 0.116354 | 0.058177 |
| Populatie | 70010.4214182505 | 6087.170058 | 11.5013 | 0 | 0 |
| Bevolkingsdicht | -94.7557257571973 | 315.299394 | -0.3005 | 0.764869 | 0.382435 |
| Werkloosheid | -94869.4011716203 | 33513.861459 | -2.8308 | 0.006404 | 0.003202 |
| Land | -280628.86326009 | 267345.479888 | -1.0497 | 0.298293 | 0.149146 |
| Multiple Linear Regression - Regression Statistics | |
| Multiple R | 0.895968436253254 |
| R-squared | 0.802759438762101 |
| Adjusted R-squared | 0.788917995868213 |
| F-TEST (value) | 57.9968031451834 |
| F-TEST (DF numerator) | 4 |
| F-TEST (DF denominator) | 57 |
| p-value | 0 |
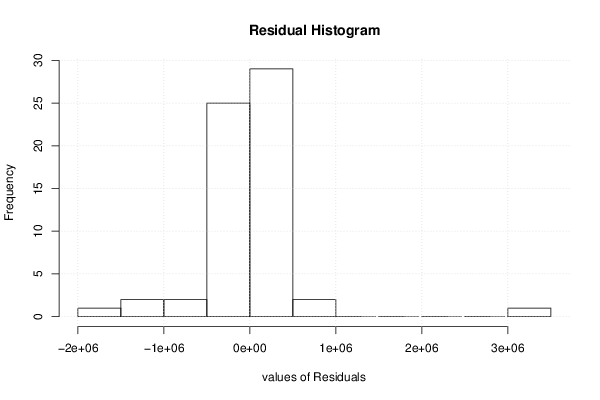
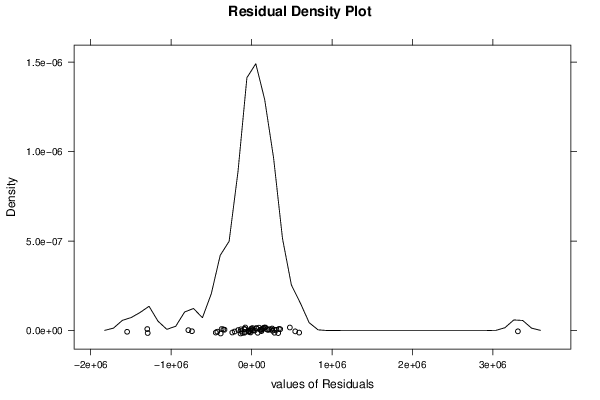
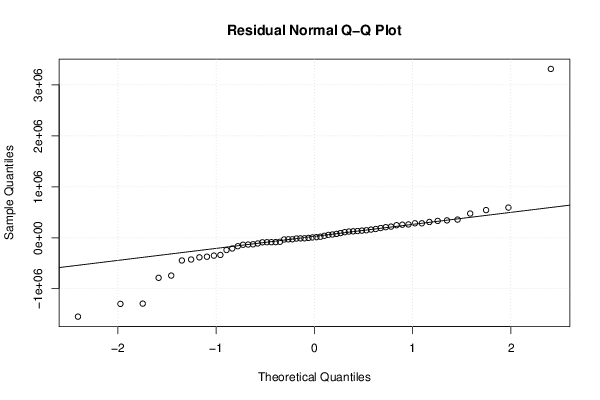
| Multiple Linear Regression - Residual Statistics | |
| Residual Standard Deviation | 606814.283835881 |
| Sum Squared Residuals | 20988743778833.4 |
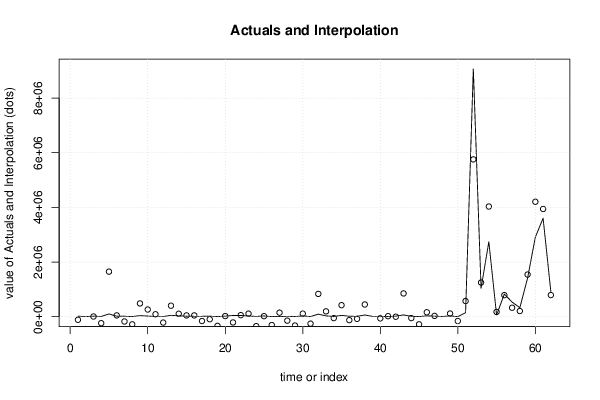
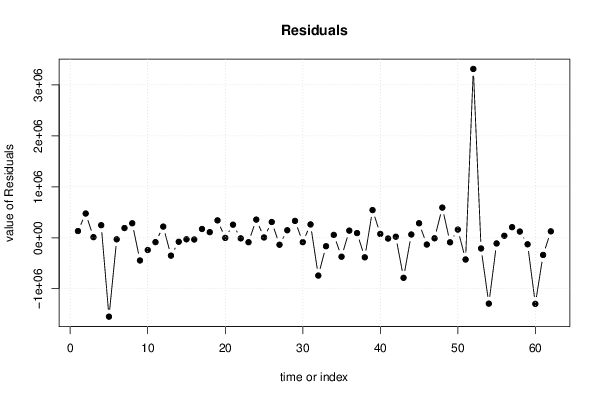
| Multiple Linear Regression - Actuals, Interpolation, and Residuals | |||
| Time or Index | Actuals | Interpolation Forecast | Residuals Prediction Error |
| 1 | 18308 | -113737.294704781 | 132045.294704781 |
| 2 | 1148 | -474026.097354483 | 475174.097354483 |
| 3 | 18068 | 6724.83442770269 | 11343.1655722973 |
| 4 | 7729 | -238272.774480163 | 246001.774480163 |
| 5 | 100484 | 1647863.07669552 | -1547379.07669552 |
| 6 | 16728 | 47206.9267645445 | -30478.9267645445 |
| 7 | 14630 | -175830.180451742 | 190460.180451742 |
| 8 | 4008 | -279903.261387536 | 283911.261387536 |
| 9 | 38927 | 484497.56841508 | -445570.56841508 |
| 10 | 22322 | 262530.174927103 | -240208.174927103 |
| 11 | 3711 | 89544.697507776 | -85833.697507776 |
| 12 | 3136 | -215406.036082935 | 218542.036082935 |
| 13 | 50508 | 401187.438247845 | -350679.438247845 |
| 14 | 28886 | 107711.910778166 | -78825.910778166 |
| 15 | 16996 | 47263.1718689034 | -30267.1718689034 |
| 16 | 13035 | 47142.19717886 | -34107.19717886 |
| 17 | 12973 | -158885.660543997 | 171858.660543997 |
| 18 | 16309 | -93357.7632093517 | 109666.763209352 |
| 19 | 5227 | -335366.152620669 | 340593.152620669 |
| 20 | 19235 | 22588.6933976827 | -3353.69339768267 |
| 21 | 44487 | -211423.573833605 | 255910.573833605 |
| 22 | 44213 | 56399.1761198619 | -12186.1761198619 |
| 23 | 23619 | 111202.919362944 | -87583.9193629443 |
| 24 | 9106 | -346989.288560838 | 356095.288560838 |
| 25 | 24917 | 19017.7647907418 | 5899.23520925815 |
| 26 | 3872 | -305228.861312655 | 309100.861312655 |
| 27 | 8945 | 146339.40600661 | -137394.40600661 |
| 28 | 2373 | -144709.18075992 | 147082.18075992 |
| 29 | 7128 | -323186.577808984 | 330314.577808984 |
| 30 | 23624 | 110259.880141391 | -86635.8801413906 |
| 31 | 5242 | -255764.689657488 | 261006.689657488 |
| 32 | 92629 | 834278.697915176 | -741649.697915176 |
| 33 | 28795 | 194913.139060638 | -166118.139060638 |
| 34 | 4487 | -51156.2772169152 | 55643.2772169152 |
| 35 | 48799 | 421090.918422319 | -372291.918422319 |
| 36 | 14067 | -125759.177757712 | 139826.177757712 |
| 37 | 12693 | -79098.7222914592 | 91791.7222914592 |
| 38 | 62184 | 446098.052859247 | -383914.052859247 |
| 39 | 9153 | -533210.544170896 | 542363.544170896 |
| 40 | 14250 | -61083.8242712821 | 75333.8242712821 |
| 41 | 3680 | 19252.3731966349 | -15572.3731966349 |
| 42 | 18063 | -1953.98828295497 | 20016.988282955 |
| 43 | 65112 | 850932.170847493 | -785820.170847493 |
| 44 | 11340 | -52269.1433281872 | 63609.1433281872 |
| 45 | 4553 | -279556.611815925 | 284109.611815925 |
| 46 | 28960 | 162054.467133476 | -133094.467133476 |
| 47 | 19201 | 30089.6866585739 | -10888.6866585739 |
| 48 | 7533 | -583706.491717993 | 591239.491717993 |
| 49 | 26343 | 115611.560910616 | -89268.5609106161 |
| 50 | 1641 | -158541.730012429 | 160182.730012429 |
| 51 | 145360 | 571870.095544953 | -426510.095544953 |
| 52 | 9066420 | 5756005.77039793 | 3310414.22960207 |
| 53 | 1038933 | 1249322.376238 | -210389.376237998 |
| 54 | 2739420 | 4031222.6197164 | -1291802.6197164 |
| 55 | 61620 | 173793.125024036 | -112173.125024036 |
| 56 | 827530 | 789205.471238033 | 38324.5287619675 |
| 57 | 534100 | 326907.612481208 | 207192.387518792 |
| 58 | 328755 | 207104.327867013 | 121650.672132987 |
| 59 | 1413895 | 1542427.60870472 | -128532.608704718 |
| 60 | 2909136 | 4205869.56216843 | -1296733.56216843 |
| 61 | 3604246 | 3941383.72844539 | -337137.728445388 |
| 62 | 917504 | 791806.702173892 | 125697.297826108 |
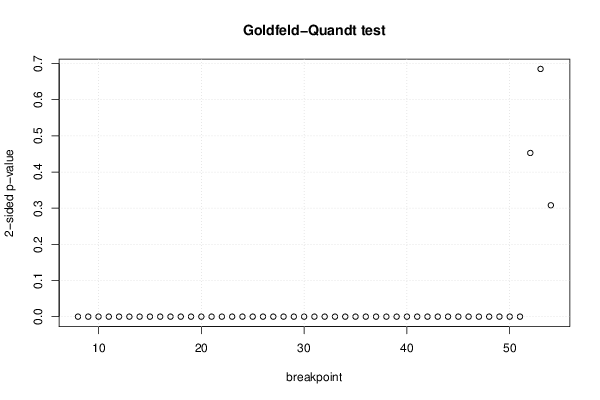
| Goldfeld-Quandt test for Heteroskedasticity | |||
| p-values | Alternative Hypothesis | ||
| breakpoint index | greater | 2-sided | less |
| 8 | 9.16824086500167e-08 | 1.83364817300033e-07 | 0.999999908317591 |
| 9 | 2.17967275372863e-09 | 4.35934550745726e-09 | 0.999999997820327 |
| 10 | 2.2939520812322e-11 | 4.5879041624644e-11 | 0.99999999997706 |
| 11 | 2.88534758200567e-13 | 5.77069516401134e-13 | 0.999999999999711 |
| 12 | 1.89327255664669e-15 | 3.78654511329338e-15 | 0.999999999999998 |
| 13 | 2.46018015990482e-16 | 4.92036031980965e-16 | 1 |
| 14 | 5.56150654859304e-18 | 1.11230130971861e-17 | 1 |
| 15 | 5.92055894347457e-20 | 1.18411178869491e-19 | 1 |
| 16 | 4.51539716311435e-22 | 9.03079432622869e-22 | 1 |
| 17 | 3.49817114531924e-24 | 6.99634229063848e-24 | 1 |
| 18 | 2.40736210499291e-26 | 4.81472420998583e-26 | 1 |
| 19 | 1.68681273591234e-28 | 3.37362547182468e-28 | 1 |
| 20 | 1.05667655511329e-30 | 2.11335311022658e-30 | 1 |
| 21 | 1.28907745251462e-30 | 2.57815490502925e-30 | 1 |
| 22 | 2.50501648941884e-32 | 5.01003297883767e-32 | 1 |
| 23 | 3.94820076641526e-34 | 7.89640153283052e-34 | 1 |
| 24 | 4.22679507378132e-36 | 8.45359014756264e-36 | 1 |
| 25 | 4.38472896062025e-38 | 8.76945792124051e-38 | 1 |
| 26 | 3.74579069159626e-40 | 7.49158138319252e-40 | 1 |
| 27 | 3.03265419110457e-42 | 6.06530838220914e-42 | 1 |
| 28 | 2.83512878940855e-44 | 5.6702575788171e-44 | 1 |
| 29 | 2.20469806139256e-46 | 4.40939612278512e-46 | 1 |
| 30 | 2.07562810860841e-47 | 4.15125621721683e-47 | 1 |
| 31 | 1.89790429547702e-49 | 3.79580859095403e-49 | 1 |
| 32 | 2.32876502061411e-48 | 4.65753004122821e-48 | 1 |
| 33 | 2.19738997056036e-50 | 4.39477994112072e-50 | 1 |
| 34 | 1.89035989681995e-52 | 3.78071979363989e-52 | 1 |
| 35 | 2.50050499803879e-54 | 5.00100999607758e-54 | 1 |
| 36 | 2.0401787131988e-56 | 4.08035742639759e-56 | 1 |
| 37 | 1.58360120425386e-58 | 3.16720240850773e-58 | 1 |
| 38 | 1.11744957168394e-59 | 2.23489914336788e-59 | 1 |
| 39 | 1.13986741928413e-61 | 2.27973483856827e-61 | 1 |
| 40 | 8.59422133612371e-64 | 1.71884426722474e-63 | 1 |
| 41 | 6.04502993545889e-66 | 1.20900598709178e-65 | 1 |
| 42 | 4.4635964190002e-68 | 8.92719283800039e-68 | 1 |
| 43 | 9.88604144422356e-70 | 1.97720828884471e-69 | 1 |
| 44 | 6.97865255042587e-72 | 1.39573051008517e-71 | 1 |
| 45 | 4.35631066115411e-74 | 8.71262132230821e-74 | 1 |
| 46 | 3.09706822381682e-76 | 6.19413644763364e-76 | 1 |
| 47 | 1.85025362347176e-78 | 3.70050724694352e-78 | 1 |
| 48 | 1.78971047014369e-80 | 3.57942094028738e-80 | 1 |
| 49 | 1.28092936310531e-82 | 2.56185872621061e-82 | 1 |
| 50 | 5.8857023320457e-85 | 1.17714046640914e-84 | 1 |
| 51 | 2.47596704947367e-87 | 4.95193409894734e-87 | 1 |
| 52 | 0.773657272569658 | 0.452685454860685 | 0.226342727430342 |
| 53 | 0.657442300337949 | 0.685115399324103 | 0.342557699662051 |
| 54 | 0.845992828632077 | 0.308014342735847 | 0.154007171367923 |
| Meta Analysis of Goldfeld-Quandt test for Heteroskedasticity | |||
| Description | # significant tests | % significant tests | OK/NOK |
| 1% type I error level | 44 | 0.936170212765957 | NOK |
| 5% type I error level | 44 | 0.936170212765957 | NOK |
| 10% type I error level | 44 | 0.936170212765957 | NOK |