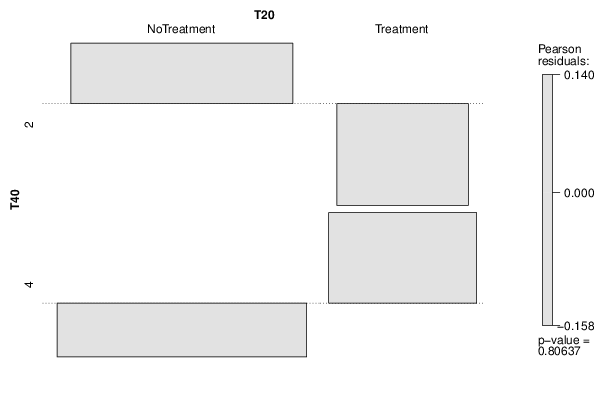
| Tabulation of Results | ||
| T40 x T20 | ||
| NoTreatment | Treatment | 2 | 51 | 17 | 4 | 63 | 23 |
| Tabulation of Expected Results | ||
| T40 x T20 | ||
| NoTreatment | Treatment | 2 | 50.34 | 17.66 | 4 | 63.66 | 22.34 |
| Statistical Results | |
| Pearson's Chi-squared test with Yates' continuity correction | |
| Pearson Chi Square Statistic | 0 |
| Degrees of Freedom | 1 |
| P value | 0.95 |