| Tabulation of Results | ||
| T40 x Outcome | ||
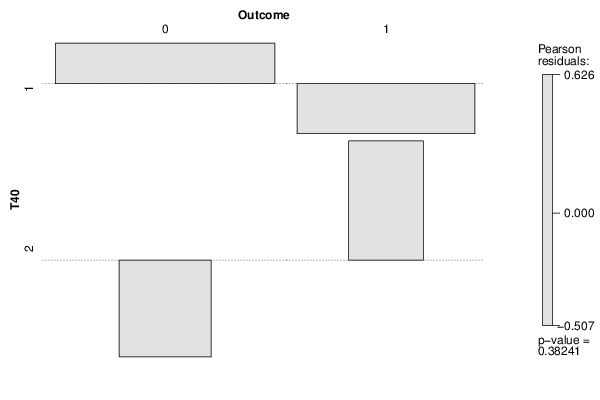
| 0 | 1 | 1 | 81 | 50 | 2 | 12 | 11 |
| Tabulation of Expected Results | ||
| T40 x Outcome | ||
| 0 | 1 | 1 | 79.11 | 51.89 | 2 | 13.89 | 9.11 |
| Statistical Results | |
| Pearson's Chi-squared test with simulated p-value (based on 2000 replicates) | |
| Exact Pearson Chi Square Statistic | 0.76 |
| P value | 0.49 |