| Multiple Linear Regression - Estimated Regression Equation |
| veilingprijs [t] = -921.502782614554 + 11.0866531238829ouderdom[t] + 64.0268585413019aanbieders[t] + e[t] |
| Multiple Linear Regression - Ordinary Least Squares | |||||
| Variable | Parameter | S.D. | T-STAT H0: parameter = 0 | 2-tail p-value | 1-tail p-value |
| (Intercept) | -921.502782614554 | 258.686341 | -3.5622 | 0.001294 | 0.000647 |
| ouderdom | 11.0866531238829 | 1.346555 | 8.2333 | 0 | 0 |
| aanbieders | 64.0268585413019 | 12.990948 | 4.9286 | 3.1e-05 | 1.5e-05 |
| Multiple Linear Regression - Regression Statistics | |
| Multiple R | 0.851393202809875 |
| R-squared | 0.724870385790857 |
| Adjusted R-squared | 0.705895929638502 |
| F-TEST (value) | 38.202432784926 |
| F-TEST (DF numerator) | 2 |
| F-TEST (DF denominator) | 29 |
| p-value | 7.46949802010732e-09 |
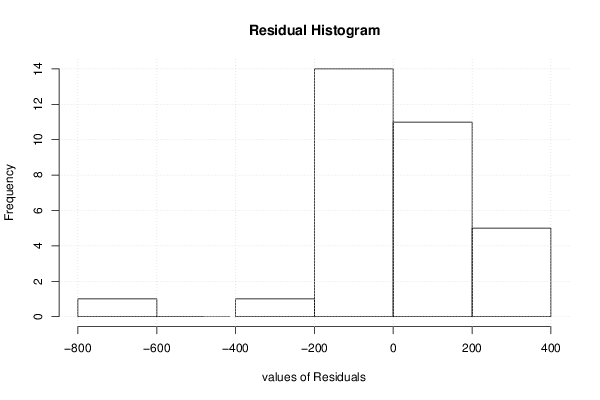
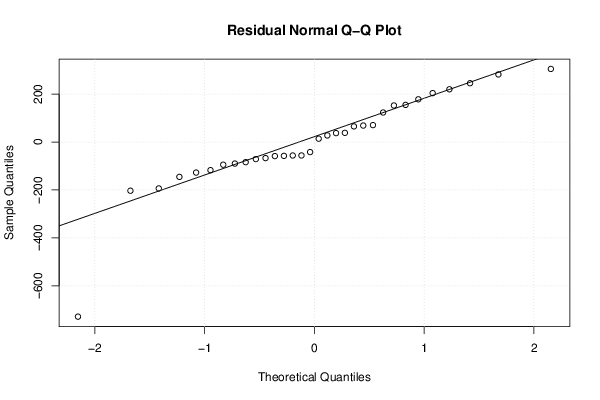
| Multiple Linear Regression - Residual Statistics | |
| Residual Standard Deviation | 198.669613553321 |
| Sum Squared Residuals | 1144618.84513335 |
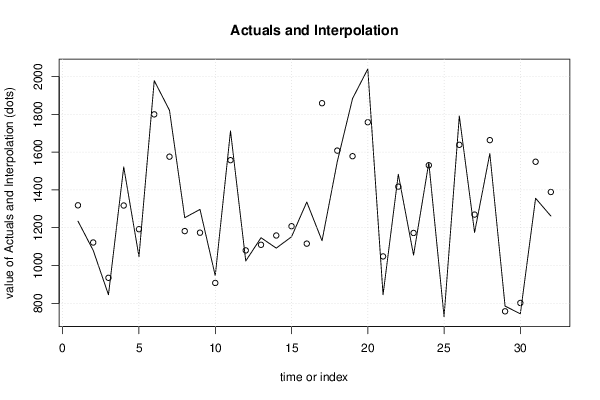
| Multiple Linear Regression - Actuals, Interpolation, and Residuals | |||
| Time or Index | Actuals | Interpolation Forecast | Residuals Prediction Error |
| 1 | 1235 | 1318.85132515549 | -83.8513251554931 |
| 2 | 1080 | 1121.7846291276 | -41.7846291275962 |
| 3 | 845 | 934.690173907681 | -89.6901739076809 |
| 4 | 1522 | 1317.73691283959 | 204.26308716041 |
| 5 | 1047 | 1192.17625595898 | -145.176255958982 |
| 6 | 1979 | 1800.56352988645 | 178.436470113555 |
| 7 | 1822 | 1576.33740720679 | 245.662592793207 |
| 8 | 1253 | 1182.204015151 | 70.7959848489992 |
| 9 | 1297 | 1173.61042222911 | 123.389577770887 |
| 10 | 946 | 907.530747255925 | 38.4692527440752 |
| 11 | 1713 | 1557.77157347692 | 155.228426523075 |
| 12 | 1024 | 1079.93107683406 | -55.93107683406 |
| 13 | 1147 | 1109.58356368781 | 37.4164363121887 |
| 14 | 1092 | 1158.91629658733 | -66.9162965873331 |
| 15 | 1152 | 1207.98479391666 | -55.9847939166638 |
| 16 | 1336 | 1115.6840964077 | 220.315903592296 |
| 17 | 1131 | 1859.60426802376 | -728.604268023757 |
| 18 | 1550 | 1608.48295426254 | -58.4829542625396 |
| 19 | 1884 | 1578.83046740879 | 305.169532591212 |
| 20 | 2041 | 1758.70997759291 | 282.290022407091 |
| 21 | 845 | 1048.0497653485 | -203.049765348505 |
| 22 | 1483 | 1417.51679095454 | 65.4832090454641 |
| 23 | 1055 | 1172.23177434302 | -117.23177434302 |
| 24 | 1545 | 1530.87638239536 | 14.1236176046403 |
| 25 | 729 | 660.016906012605 | 68.9830939873952 |
| 26 | 1792 | 1639.24985343219 | 152.750146567807 |
| 27 | 1175 | 1269.51859225597 | -94.5185922559705 |
| 28 | 1593 | 1663.91621988195 | -70.9162198819539 |
| 29 | 785 | 757.303723925555 | 27.6962760744447 |
| 30 | 744 | 801.650336421087 | -57.6503364210867 |
| 31 | 1356 | 1549.44221612523 | -193.442216125228 |
| 32 | 1262 | 1389.24295198688 | -127.242951986878 |
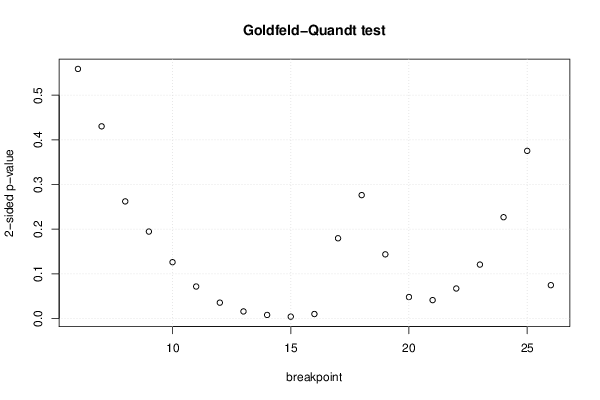
| Goldfeld-Quandt test for Heteroskedasticity | |||
| p-values | Alternative Hypothesis | ||
| breakpoint index | greater | 2-sided | less |
| 6 | 0.279423333075033 | 0.558846666150066 | 0.720576666924967 |
| 7 | 0.215157140621238 | 0.430314281242475 | 0.784842859378762 |
| 8 | 0.131107349451313 | 0.262214698902626 | 0.868892650548687 |
| 9 | 0.097315365334733 | 0.194630730669466 | 0.902684634665267 |
| 10 | 0.0630193465587558 | 0.126038693117512 | 0.936980653441244 |
| 11 | 0.0357817031161608 | 0.0715634062323217 | 0.964218296883839 |
| 12 | 0.0176846472331688 | 0.0353692944663375 | 0.982315352766831 |
| 13 | 0.00787403007896749 | 0.015748060157935 | 0.992125969921033 |
| 14 | 0.00392866056476016 | 0.00785732112952033 | 0.99607133943524 |
| 15 | 0.00202049247797559 | 0.00404098495595118 | 0.997979507522024 |
| 16 | 0.00497512066777697 | 0.00995024133555393 | 0.995024879332223 |
| 17 | 0.910185754281862 | 0.179628491436275 | 0.0898142457181377 |
| 18 | 0.861875163098564 | 0.276249673802871 | 0.138124836901436 |
| 19 | 0.928196562313881 | 0.143606875372238 | 0.0718034376861191 |
| 20 | 0.976004725020296 | 0.0479905499594071 | 0.0239952749797035 |
| 21 | 0.979473834856973 | 0.0410523302860534 | 0.0205261651430267 |
| 22 | 0.966439420758251 | 0.0671211584834984 | 0.0335605792417492 |
| 23 | 0.939680933619597 | 0.120638132760805 | 0.0603190663804026 |
| 24 | 0.886600059157595 | 0.22679988168481 | 0.113399940842405 |
| 25 | 0.812320163859386 | 0.375359672281229 | 0.187679836140614 |
| 26 | 0.962743690546133 | 0.0745126189077334 | 0.0372563094538667 |
| Meta Analysis of Goldfeld-Quandt test for Heteroskedasticity | |||
| Description | # significant tests | % significant tests | OK/NOK |
| 1% type I error level | 3 | 0.142857142857143 | NOK |
| 5% type I error level | 7 | 0.333333333333333 | NOK |
| 10% type I error level | 10 | 0.476190476190476 | NOK |