| Multiple Linear Regression - Estimated Regression Equation |
| [t] = + 1.4791 -0.0183516666666665M1[t] -0.0120766666666666M2[t] -0.0254949999999999M3[t] -0.0196533333333333M4[t] + 0.0135083333333333M5[t] + 0.01743M6[t] -0.00954833333333338M7[t] + 0.00375333333333337M8[t] + 0.00901499999999997M9[t] + 0.000636666666666737M10[t] + 0.00929833333333332M11[t] -0.00308166666666667t + e[t] |
| Multiple Linear Regression - Ordinary Least Squares | |||||
| Variable | Parameter | S.D. | T-STAT H0: parameter = 0 | 2-tail p-value | 1-tail p-value |
| (Intercept) | 1.4791 | 0.044768 | 33.0394 | 0 | 0 |
| M1 | -0.0183516666666665 | 0.05221 | -0.3515 | 0.726752 | 0.363376 |
| M2 | -0.0120766666666666 | 0.0548 | -0.2204 | 0.826511 | 0.413256 |
| M3 | -0.0254949999999999 | 0.05473 | -0.4658 | 0.643441 | 0.32172 |
| M4 | -0.0196533333333333 | 0.054667 | -0.3595 | 0.72079 | 0.360395 |
| M5 | 0.0135083333333333 | 0.054612 | 0.2474 | 0.80569 | 0.402845 |
| M6 | 0.01743 | 0.054564 | 0.3194 | 0.750776 | 0.375388 |
| M7 | -0.00954833333333338 | 0.054523 | -0.1751 | 0.861718 | 0.430859 |
| M8 | 0.00375333333333337 | 0.05449 | 0.0689 | 0.94537 | 0.472685 |
| M9 | 0.00901499999999997 | 0.054464 | 0.1655 | 0.869227 | 0.434614 |
| M10 | 0.000636666666666737 | 0.054445 | 0.0117 | 0.990718 | 0.495359 |
| M11 | 0.00929833333333332 | 0.054434 | 0.1708 | 0.865085 | 0.432542 |
| t | -0.00308166666666667 | 0.000635 | -4.8519 | 1.3e-05 | 7e-06 |
| Multiple Linear Regression - Regression Statistics | |
| Multiple R | 0.583443416087813 |
| R-squared | 0.340406219776216 |
| Adjusted R-squared | 0.175507774720271 |
| F-TEST (value) | 2.06433856705395 |
| F-TEST (DF numerator) | 12 |
| F-TEST (DF denominator) | 48 |
| p-value | 0.0382316141532347 |
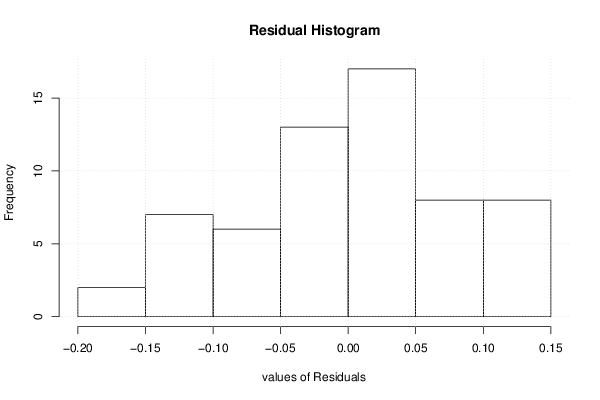
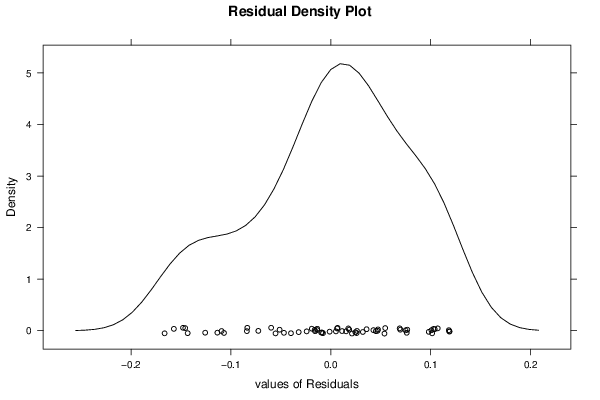
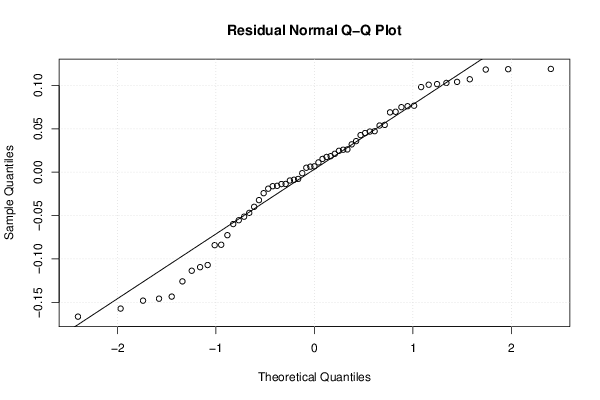
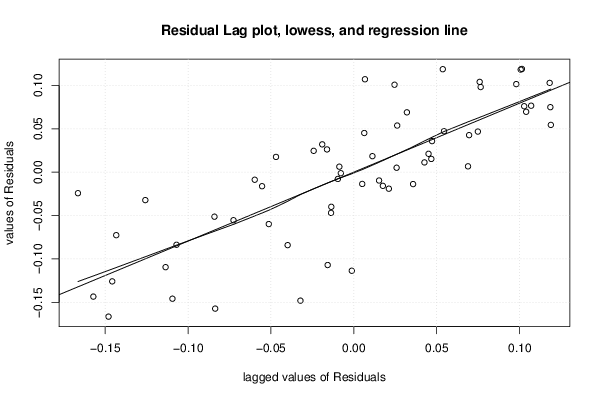
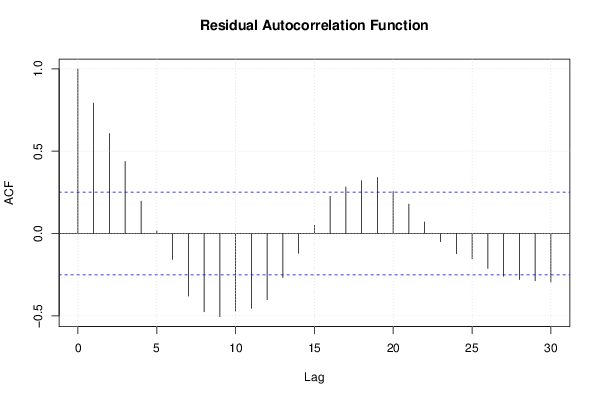
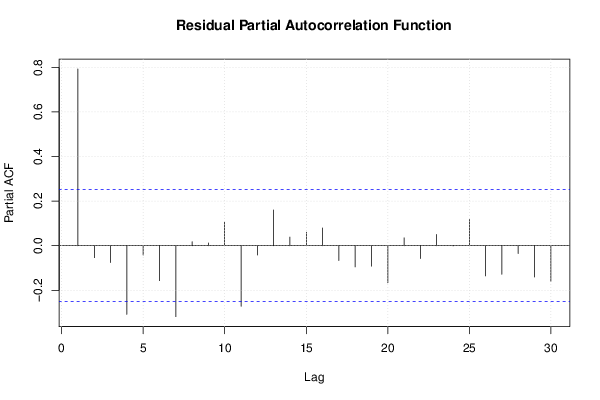
| Multiple Linear Regression - Residual Statistics | |
| Residual Standard Deviation | 0.0860619003650538 |
| Sum Squared Residuals | 0.355519233333333 |
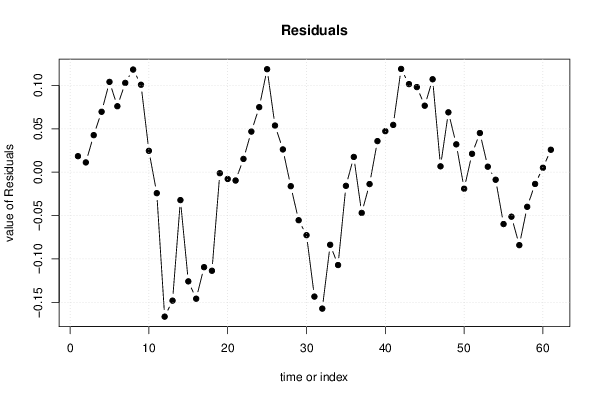
| Multiple Linear Regression - Actuals, Interpolation, and Residuals | |||
| Time or Index | Actuals | Interpolation Forecast | Residuals Prediction Error |
| 1 | 1.4761 | 1.45766666666667 | 0.0184333333333341 |
| 2 | 1.4721 | 1.46086 | 0.0112399999999999 |
| 3 | 1.487 | 1.44436 | 0.04264 |
| 4 | 1.5167 | 1.44712 | 0.0695799999999999 |
| 5 | 1.5812 | 1.4772 | 0.104 |
| 6 | 1.554 | 1.47804 | 0.0759600000000001 |
| 7 | 1.5508 | 1.44798 | 0.10282 |
| 8 | 1.5764 | 1.4582 | 0.1182 |
| 9 | 1.5611 | 1.46038 | 0.10072 |
| 10 | 1.4735 | 1.44892 | 0.02458 |
| 11 | 1.4303 | 1.4545 | -0.0242000000000001 |
| 12 | 1.2757 | 1.44212 | -0.16642 |
| 13 | 1.2727 | 1.42068666666667 | -0.147986666666667 |
| 14 | 1.3917 | 1.42388 | -0.0321800000000001 |
| 15 | 1.2816 | 1.40738 | -0.12578 |
| 16 | 1.2644 | 1.41014 | -0.14574 |
| 17 | 1.3308 | 1.44022 | -0.10942 |
| 18 | 1.3275 | 1.44106 | -0.11356 |
| 19 | 1.4098 | 1.411 | -0.00120000000000003 |
| 20 | 1.4134 | 1.42122 | -0.00782000000000005 |
| 21 | 1.4138 | 1.4234 | -0.00960000000000003 |
| 22 | 1.4272 | 1.41194 | 0.01526 |
| 23 | 1.4643 | 1.41752 | 0.04678 |
| 24 | 1.48 | 1.40514 | 0.07486 |
| 25 | 1.5023 | 1.38370666666667 | 0.118593333333333 |
| 26 | 1.4406 | 1.3869 | 0.0537000000000001 |
| 27 | 1.3966 | 1.3704 | 0.0262 |
| 28 | 1.357 | 1.37316 | -0.01616 |
| 29 | 1.3479 | 1.40324 | -0.0553399999999999 |
| 30 | 1.3315 | 1.40408 | -0.0725800000000001 |
| 31 | 1.2307 | 1.37402 | -0.14332 |
| 32 | 1.2271 | 1.38424 | -0.15714 |
| 33 | 1.3028 | 1.38642 | -0.08362 |
| 34 | 1.268 | 1.37496 | -0.10696 |
| 35 | 1.3648 | 1.38054 | -0.01574 |
| 36 | 1.3857 | 1.36816 | 0.01754 |
| 37 | 1.2998 | 1.34672666666667 | -0.0469266666666667 |
| 38 | 1.3362 | 1.34992 | -0.0137199999999999 |
| 39 | 1.3692 | 1.33342 | 0.0357799999999999 |
| 40 | 1.3834 | 1.33618 | 0.04722 |
| 41 | 1.4207 | 1.36626 | 0.0544400000000001 |
| 42 | 1.486 | 1.3671 | 0.1189 |
| 43 | 1.4385 | 1.33704 | 0.10146 |
| 44 | 1.4453 | 1.34726 | 0.09804 |
| 45 | 1.426 | 1.34944 | 0.07656 |
| 46 | 1.445 | 1.33798 | 0.10702 |
| 47 | 1.3503 | 1.34356 | 0.00674000000000011 |
| 48 | 1.4001 | 1.33118 | 0.0689199999999999 |
| 49 | 1.3418 | 1.30974666666667 | 0.0320533333333333 |
| 50 | 1.2939 | 1.31294 | -0.0190399999999999 |
| 51 | 1.3176 | 1.29644 | 0.0211600000000001 |
| 52 | 1.3443 | 1.2992 | 0.0451000000000001 |
| 53 | 1.3356 | 1.32928 | 0.00631999999999996 |
| 54 | 1.3214 | 1.33012 | -0.00872 |
| 55 | 1.2403 | 1.30006 | -0.0597599999999999 |
| 56 | 1.259 | 1.31028 | -0.05128 |
| 57 | 1.2284 | 1.31246 | -0.08406 |
| 58 | 1.2611 | 1.301 | -0.0398999999999999 |
| 59 | 1.293 | 1.30658 | -0.01358 |
| 60 | 1.2993 | 1.2942 | 0.00509999999999997 |
| 61 | 1.2986 | 1.27276666666667 | 0.0258333333333332 |
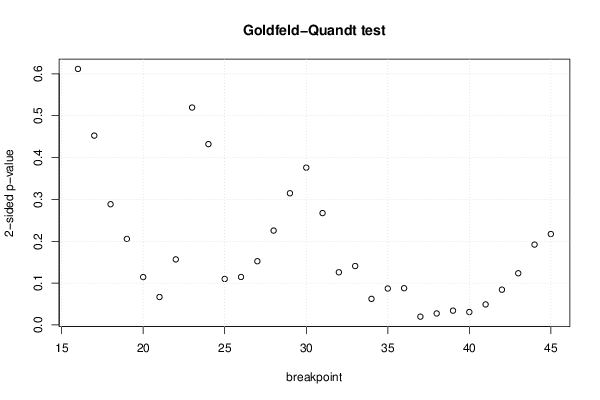
| Goldfeld-Quandt test for Heteroskedasticity | |||
| p-values | Alternative Hypothesis | ||
| breakpoint index | greater | 2-sided | less |
| 16 | 0.305887464790934 | 0.611774929581868 | 0.694112535209066 |
| 17 | 0.226257499280885 | 0.452514998561771 | 0.773742500719115 |
| 18 | 0.14422843369881 | 0.28845686739762 | 0.85577156630119 |
| 19 | 0.102747495196039 | 0.205494990392078 | 0.897252504803961 |
| 20 | 0.0572063007360272 | 0.114412601472054 | 0.942793699263973 |
| 21 | 0.0333605112029222 | 0.0667210224058444 | 0.966639488797078 |
| 22 | 0.0782942352867811 | 0.156588470573562 | 0.921705764713219 |
| 23 | 0.259778644168111 | 0.519557288336222 | 0.740221355831889 |
| 24 | 0.783946732845817 | 0.432106534308367 | 0.216053267154183 |
| 25 | 0.945054846046845 | 0.109890307906311 | 0.0549451539531553 |
| 26 | 0.942689843004989 | 0.114620313990022 | 0.0573101569950112 |
| 27 | 0.923872123186955 | 0.152255753626089 | 0.0761278768130447 |
| 28 | 0.88724696057038 | 0.225506078859241 | 0.11275303942962 |
| 29 | 0.842648921066387 | 0.314702157867227 | 0.157351078933613 |
| 30 | 0.812054786226997 | 0.375890427546005 | 0.187945213773003 |
| 31 | 0.866346072580477 | 0.267307854839046 | 0.133653927419523 |
| 32 | 0.937069720585441 | 0.125860558829119 | 0.0629302794145593 |
| 33 | 0.92959763011219 | 0.14080473977562 | 0.0704023698878101 |
| 34 | 0.968824102150086 | 0.0623517956998273 | 0.0311758978499137 |
| 35 | 0.956467939573058 | 0.0870641208538836 | 0.0435320604269418 |
| 36 | 0.956121043336709 | 0.0877579133265814 | 0.0438789566632907 |
| 37 | 0.990100276962129 | 0.0197994460757422 | 0.00989972303787112 |
| 38 | 0.986292710489679 | 0.0274145790206427 | 0.0137072895103213 |
| 39 | 0.982955643832906 | 0.0340887123341879 | 0.017044356167094 |
| 40 | 0.984604001409482 | 0.0307919971810363 | 0.0153959985905182 |
| 41 | 0.975495624488586 | 0.0490087510228272 | 0.0245043755114136 |
| 42 | 0.957874426831338 | 0.0842511463373234 | 0.0421255731686617 |
| 43 | 0.93823525577807 | 0.12352948844386 | 0.06176474422193 |
| 44 | 0.903995293984422 | 0.192009412031156 | 0.0960047060155778 |
| 45 | 0.891361142742533 | 0.217277714514934 | 0.108638857257467 |
| Meta Analysis of Goldfeld-Quandt test for Heteroskedasticity | |||
| Description | # significant tests | % significant tests | OK/NOK |
| 1% type I error level | 0 | 0 | OK |
| 5% type I error level | 5 | 0.166666666666667 | NOK |
| 10% type I error level | 10 | 0.333333333333333 | NOK |