Free Statistics

of Irreproducible Research!

Author's title

Author*The author of this computation has been verified*
R Software Modulerwasp_multipleregression.wasp
Title produced by softwareMultiple Regression
Date of computationFri, 21 Dec 2012 06:22:02 -0500
Cite this page as followsStatistical Computations at FreeStatistics.org, Office for Research Development and Education, URL https://freestatistics.org/blog/index.php?v=date/2012/Dec/21/t1356088946sth0lequvtyyv0x.htm/, Retrieved Thu, 25 Apr 2024 08:52:56 +0000
Statistical Computations at FreeStatistics.org, Office for Research Development and Education, URL https://freestatistics.org/blog/index.php?pk=203485, Retrieved Thu, 25 Apr 2024 08:52:56 +0000
QR Codes:

Original text written by user:
IsPrivate?No (this computation is public)
User-defined keywords
Estimated Impact98
Family? (F = Feedback message, R = changed R code, M = changed R Module, P = changed Parameters, D = changed Data)
-     [Multiple Regression] [HPC Retail Sales] [2008-03-08 13:40:54] [1c0f2c85e8a48e42648374b3bcceca26]
- RMPD  [Multiple Regression] [forecast] [2012-11-24 21:49:17] [0883bf8f4217d775edf6393676d58a73]
- R  D      [Multiple Regression] [] [2012-12-21 11:22:02] [b650a28572edc4a1d205c228043a3295] [Current]
- RMP         [(Partial) Autocorrelation Function] [] [2012-12-21 15:18:29] [0604709baf8ca89a71bc0fcadc3cdffd]
- R             [(Partial) Autocorrelation Function] [] [2012-12-21 16:03:13] [0604709baf8ca89a71bc0fcadc3cdffd]
- RM            [Variance Reduction Matrix] [] [2012-12-21 16:08:14] [0604709baf8ca89a71bc0fcadc3cdffd]
- RM            [Standard Deviation-Mean Plot] [] [2012-12-21 16:27:44] [0604709baf8ca89a71bc0fcadc3cdffd]
Feedback Forum

Post a new message
Dataseries X:
1.4761
1.4721
1.487
1.5167
1.5812
1.554
1.5508
1.5764
1.5611
1.4735
1.4303
1.2757
1.2727
1.3917
1.2816
1.2644
1.3308
1.3275
1.4098
1.4134
1.4138
1.4272
1.4643
1.48
1.5023
1.4406
1.3966
1.357
1.3479
1.3315
1.2307
1.2271
1.3028
1.268
1.3648
1.3857
1.2998
1.3362
1.3692
1.3834
1.4207
1.486
1.4385
1.4453
1.426
1.445
1.3503
1.4001
1.3418
1.2939
1.3176
1.3443
1.3356
1.3214
1.2403
1.259
1.2284
1.2611
1.293
1.2993
1.2986


Summary of computational transaction
Raw Inputview raw input (R code)
Raw Outputview raw output of R engine
Computing time9 seconds
R Server'George Udny Yule' @ yule.wessa.net

\begin{tabular}{lllllllll}
\hline
Summary of computational transaction \tabularnewline
Raw Input & view raw input (R code)  \tabularnewline
Raw Output & view raw output of R engine  \tabularnewline
Computing time & 9 seconds \tabularnewline
R Server & 'George Udny Yule' @ yule.wessa.net \tabularnewline
\hline
\end{tabular}
%Source: https://freestatistics.org/blog/index.php?pk=203485&T=0

[TABLE]
[ROW][C]Summary of computational transaction[/C][/ROW]
[ROW][C]Raw Input[/C][C]view raw input (R code) [/C][/ROW]
[ROW][C]Raw Output[/C][C]view raw output of R engine [/C][/ROW]
[ROW][C]Computing time[/C][C]9 seconds[/C][/ROW]
[ROW][C]R Server[/C][C]'George Udny Yule' @ yule.wessa.net[/C][/ROW]
[/TABLE]
Source: https://freestatistics.org/blog/index.php?pk=203485&T=0

Globally Unique Identifier (entire table): ba.freestatistics.org/blog/index.php?pk=203485&T=0

As an alternative you can also use a QR Code:  

The GUIDs for individual cells are displayed in the table below:

Summary of computational transaction
Raw Inputview raw input (R code)
Raw Outputview raw output of R engine
Computing time9 seconds
R Server'George Udny Yule' @ yule.wessa.net


Multiple Linear Regression - Estimated Regression Equation
[t] = + 1.4791 -0.0183516666666665M1[t] -0.0120766666666666M2[t] -0.0254949999999999M3[t] -0.0196533333333333M4[t] + 0.0135083333333333M5[t] + 0.01743M6[t] -0.00954833333333338M7[t] + 0.00375333333333337M8[t] + 0.00901499999999997M9[t] + 0.000636666666666737M10[t] + 0.00929833333333332M11[t] -0.00308166666666667t + e[t]

\begin{tabular}{lllllllll}
\hline
Multiple Linear Regression - Estimated Regression Equation \tabularnewline
[t] =  +  1.4791 -0.0183516666666665M1[t] -0.0120766666666666M2[t] -0.0254949999999999M3[t] -0.0196533333333333M4[t] +  0.0135083333333333M5[t] +  0.01743M6[t] -0.00954833333333338M7[t] +  0.00375333333333337M8[t] +  0.00901499999999997M9[t] +  0.000636666666666737M10[t] +  0.00929833333333332M11[t] -0.00308166666666667t  + e[t] \tabularnewline
\hline
\end{tabular}
%Source: https://freestatistics.org/blog/index.php?pk=203485&T=1

[TABLE]
[ROW][C]Multiple Linear Regression - Estimated Regression Equation[/C][/ROW]
[ROW][C][t] =  +  1.4791 -0.0183516666666665M1[t] -0.0120766666666666M2[t] -0.0254949999999999M3[t] -0.0196533333333333M4[t] +  0.0135083333333333M5[t] +  0.01743M6[t] -0.00954833333333338M7[t] +  0.00375333333333337M8[t] +  0.00901499999999997M9[t] +  0.000636666666666737M10[t] +  0.00929833333333332M11[t] -0.00308166666666667t  + e[t][/C][/ROW]
[/TABLE]
Source: https://freestatistics.org/blog/index.php?pk=203485&T=1

Globally Unique Identifier (entire table): ba.freestatistics.org/blog/index.php?pk=203485&T=1

As an alternative you can also use a QR Code:  

The GUIDs for individual cells are displayed in the table below:

Multiple Linear Regression - Estimated Regression Equation
[t] = + 1.4791 -0.0183516666666665M1[t] -0.0120766666666666M2[t] -0.0254949999999999M3[t] -0.0196533333333333M4[t] + 0.0135083333333333M5[t] + 0.01743M6[t] -0.00954833333333338M7[t] + 0.00375333333333337M8[t] + 0.00901499999999997M9[t] + 0.000636666666666737M10[t] + 0.00929833333333332M11[t] -0.00308166666666667t + e[t]


Multiple Linear Regression - Ordinary Least Squares
VariableParameterS.D.T-STATH0: parameter = 02-tail p-value1-tail p-value
(Intercept)1.47910.04476833.039400
M1-0.01835166666666650.05221-0.35150.7267520.363376
M2-0.01207666666666660.0548-0.22040.8265110.413256
M3-0.02549499999999990.05473-0.46580.6434410.32172
M4-0.01965333333333330.054667-0.35950.720790.360395
M50.01350833333333330.0546120.24740.805690.402845
M60.017430.0545640.31940.7507760.375388
M7-0.009548333333333380.054523-0.17510.8617180.430859
M80.003753333333333370.054490.06890.945370.472685
M90.009014999999999970.0544640.16550.8692270.434614
M100.0006366666666667370.0544450.01170.9907180.495359
M110.009298333333333320.0544340.17080.8650850.432542
t-0.003081666666666670.000635-4.85191.3e-057e-06

\begin{tabular}{lllllllll}
\hline
Multiple Linear Regression - Ordinary Least Squares \tabularnewline
Variable & Parameter & S.D. & T-STATH0: parameter = 0 & 2-tail p-value & 1-tail p-value \tabularnewline
(Intercept) & 1.4791 & 0.044768 & 33.0394 & 0 & 0 \tabularnewline
M1 & -0.0183516666666665 & 0.05221 & -0.3515 & 0.726752 & 0.363376 \tabularnewline
M2 & -0.0120766666666666 & 0.0548 & -0.2204 & 0.826511 & 0.413256 \tabularnewline
M3 & -0.0254949999999999 & 0.05473 & -0.4658 & 0.643441 & 0.32172 \tabularnewline
M4 & -0.0196533333333333 & 0.054667 & -0.3595 & 0.72079 & 0.360395 \tabularnewline
M5 & 0.0135083333333333 & 0.054612 & 0.2474 & 0.80569 & 0.402845 \tabularnewline
M6 & 0.01743 & 0.054564 & 0.3194 & 0.750776 & 0.375388 \tabularnewline
M7 & -0.00954833333333338 & 0.054523 & -0.1751 & 0.861718 & 0.430859 \tabularnewline
M8 & 0.00375333333333337 & 0.05449 & 0.0689 & 0.94537 & 0.472685 \tabularnewline
M9 & 0.00901499999999997 & 0.054464 & 0.1655 & 0.869227 & 0.434614 \tabularnewline
M10 & 0.000636666666666737 & 0.054445 & 0.0117 & 0.990718 & 0.495359 \tabularnewline
M11 & 0.00929833333333332 & 0.054434 & 0.1708 & 0.865085 & 0.432542 \tabularnewline
t & -0.00308166666666667 & 0.000635 & -4.8519 & 1.3e-05 & 7e-06 \tabularnewline
\hline
\end{tabular}
%Source: https://freestatistics.org/blog/index.php?pk=203485&T=2

[TABLE]
[ROW][C]Multiple Linear Regression - Ordinary Least Squares[/C][/ROW]
[ROW][C]Variable[/C][C]Parameter[/C][C]S.D.[/C][C]T-STATH0: parameter = 0[/C][C]2-tail p-value[/C][C]1-tail p-value[/C][/ROW]
[ROW][C](Intercept)[/C][C]1.4791[/C][C]0.044768[/C][C]33.0394[/C][C]0[/C][C]0[/C][/ROW]
[ROW][C]M1[/C][C]-0.0183516666666665[/C][C]0.05221[/C][C]-0.3515[/C][C]0.726752[/C][C]0.363376[/C][/ROW]
[ROW][C]M2[/C][C]-0.0120766666666666[/C][C]0.0548[/C][C]-0.2204[/C][C]0.826511[/C][C]0.413256[/C][/ROW]
[ROW][C]M3[/C][C]-0.0254949999999999[/C][C]0.05473[/C][C]-0.4658[/C][C]0.643441[/C][C]0.32172[/C][/ROW]
[ROW][C]M4[/C][C]-0.0196533333333333[/C][C]0.054667[/C][C]-0.3595[/C][C]0.72079[/C][C]0.360395[/C][/ROW]
[ROW][C]M5[/C][C]0.0135083333333333[/C][C]0.054612[/C][C]0.2474[/C][C]0.80569[/C][C]0.402845[/C][/ROW]
[ROW][C]M6[/C][C]0.01743[/C][C]0.054564[/C][C]0.3194[/C][C]0.750776[/C][C]0.375388[/C][/ROW]
[ROW][C]M7[/C][C]-0.00954833333333338[/C][C]0.054523[/C][C]-0.1751[/C][C]0.861718[/C][C]0.430859[/C][/ROW]
[ROW][C]M8[/C][C]0.00375333333333337[/C][C]0.05449[/C][C]0.0689[/C][C]0.94537[/C][C]0.472685[/C][/ROW]
[ROW][C]M9[/C][C]0.00901499999999997[/C][C]0.054464[/C][C]0.1655[/C][C]0.869227[/C][C]0.434614[/C][/ROW]
[ROW][C]M10[/C][C]0.000636666666666737[/C][C]0.054445[/C][C]0.0117[/C][C]0.990718[/C][C]0.495359[/C][/ROW]
[ROW][C]M11[/C][C]0.00929833333333332[/C][C]0.054434[/C][C]0.1708[/C][C]0.865085[/C][C]0.432542[/C][/ROW]
[ROW][C]t[/C][C]-0.00308166666666667[/C][C]0.000635[/C][C]-4.8519[/C][C]1.3e-05[/C][C]7e-06[/C][/ROW]
[/TABLE]
Source: https://freestatistics.org/blog/index.php?pk=203485&T=2

Globally Unique Identifier (entire table): ba.freestatistics.org/blog/index.php?pk=203485&T=2

As an alternative you can also use a QR Code:  

The GUIDs for individual cells are displayed in the table below:

Multiple Linear Regression - Ordinary Least Squares
VariableParameterS.D.T-STATH0: parameter = 02-tail p-value1-tail p-value
(Intercept)1.47910.04476833.039400
M1-0.01835166666666650.05221-0.35150.7267520.363376
M2-0.01207666666666660.0548-0.22040.8265110.413256
M3-0.02549499999999990.05473-0.46580.6434410.32172
M4-0.01965333333333330.054667-0.35950.720790.360395
M50.01350833333333330.0546120.24740.805690.402845
M60.017430.0545640.31940.7507760.375388
M7-0.009548333333333380.054523-0.17510.8617180.430859
M80.003753333333333370.054490.06890.945370.472685
M90.009014999999999970.0544640.16550.8692270.434614
M100.0006366666666667370.0544450.01170.9907180.495359
M110.009298333333333320.0544340.17080.8650850.432542
t-0.003081666666666670.000635-4.85191.3e-057e-06


Multiple Linear Regression - Regression Statistics
Multiple R0.583443416087813
R-squared0.340406219776216
Adjusted R-squared0.175507774720271
F-TEST (value)2.06433856705395
F-TEST (DF numerator)12
F-TEST (DF denominator)48
p-value0.0382316141532347
Multiple Linear Regression - Residual Statistics
Residual Standard Deviation0.0860619003650538
Sum Squared Residuals0.355519233333333

\begin{tabular}{lllllllll}
\hline
Multiple Linear Regression - Regression Statistics \tabularnewline
Multiple R & 0.583443416087813 \tabularnewline
R-squared & 0.340406219776216 \tabularnewline
Adjusted R-squared & 0.175507774720271 \tabularnewline
F-TEST (value) & 2.06433856705395 \tabularnewline
F-TEST (DF numerator) & 12 \tabularnewline
F-TEST (DF denominator) & 48 \tabularnewline
p-value & 0.0382316141532347 \tabularnewline
Multiple Linear Regression - Residual Statistics \tabularnewline
Residual Standard Deviation & 0.0860619003650538 \tabularnewline
Sum Squared Residuals & 0.355519233333333 \tabularnewline
\hline
\end{tabular}
%Source: https://freestatistics.org/blog/index.php?pk=203485&T=3

[TABLE]
[ROW][C]Multiple Linear Regression - Regression Statistics[/C][/ROW]
[ROW][C]Multiple R[/C][C]0.583443416087813[/C][/ROW]
[ROW][C]R-squared[/C][C]0.340406219776216[/C][/ROW]
[ROW][C]Adjusted R-squared[/C][C]0.175507774720271[/C][/ROW]
[ROW][C]F-TEST (value)[/C][C]2.06433856705395[/C][/ROW]
[ROW][C]F-TEST (DF numerator)[/C][C]12[/C][/ROW]
[ROW][C]F-TEST (DF denominator)[/C][C]48[/C][/ROW]
[ROW][C]p-value[/C][C]0.0382316141532347[/C][/ROW]
[ROW][C]Multiple Linear Regression - Residual Statistics[/C][/ROW]
[ROW][C]Residual Standard Deviation[/C][C]0.0860619003650538[/C][/ROW]
[ROW][C]Sum Squared Residuals[/C][C]0.355519233333333[/C][/ROW]
[/TABLE]
Source: https://freestatistics.org/blog/index.php?pk=203485&T=3

Globally Unique Identifier (entire table): ba.freestatistics.org/blog/index.php?pk=203485&T=3

As an alternative you can also use a QR Code:  

The GUIDs for individual cells are displayed in the table below:

Multiple Linear Regression - Regression Statistics
Multiple R0.583443416087813
R-squared0.340406219776216
Adjusted R-squared0.175507774720271
F-TEST (value)2.06433856705395
F-TEST (DF numerator)12
F-TEST (DF denominator)48
p-value0.0382316141532347
Multiple Linear Regression - Residual Statistics
Residual Standard Deviation0.0860619003650538
Sum Squared Residuals0.355519233333333


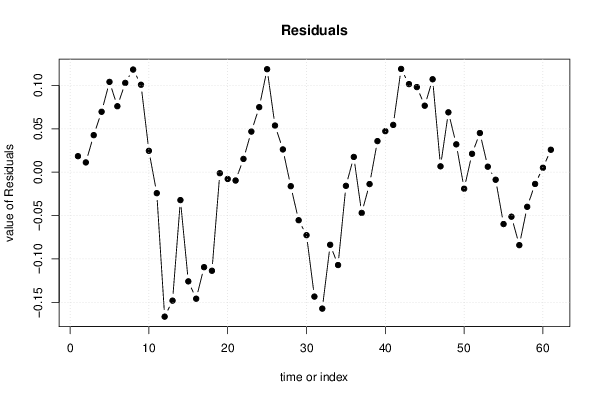
Multiple Linear Regression - Actuals, Interpolation, and Residuals
Time or IndexActualsInterpolationForecastResidualsPrediction Error
11.47611.457666666666670.0184333333333341
21.47211.460860.0112399999999999
31.4871.444360.04264
41.51671.447120.0695799999999999
51.58121.47720.104
61.5541.478040.0759600000000001
71.55081.447980.10282
81.57641.45820.1182
91.56111.460380.10072
101.47351.448920.02458
111.43031.4545-0.0242000000000001
121.27571.44212-0.16642
131.27271.42068666666667-0.147986666666667
141.39171.42388-0.0321800000000001
151.28161.40738-0.12578
161.26441.41014-0.14574
171.33081.44022-0.10942
181.32751.44106-0.11356
191.40981.411-0.00120000000000003
201.41341.42122-0.00782000000000005
211.41381.4234-0.00960000000000003
221.42721.411940.01526
231.46431.417520.04678
241.481.405140.07486
251.50231.383706666666670.118593333333333
261.44061.38690.0537000000000001
271.39661.37040.0262
281.3571.37316-0.01616
291.34791.40324-0.0553399999999999
301.33151.40408-0.0725800000000001
311.23071.37402-0.14332
321.22711.38424-0.15714
331.30281.38642-0.08362
341.2681.37496-0.10696
351.36481.38054-0.01574
361.38571.368160.01754
371.29981.34672666666667-0.0469266666666667
381.33621.34992-0.0137199999999999
391.36921.333420.0357799999999999
401.38341.336180.04722
411.42071.366260.0544400000000001
421.4861.36710.1189
431.43851.337040.10146
441.44531.347260.09804
451.4261.349440.07656
461.4451.337980.10702
471.35031.343560.00674000000000011
481.40011.331180.0689199999999999
491.34181.309746666666670.0320533333333333
501.29391.31294-0.0190399999999999
511.31761.296440.0211600000000001
521.34431.29920.0451000000000001
531.33561.329280.00631999999999996
541.32141.33012-0.00872
551.24031.30006-0.0597599999999999
561.2591.31028-0.05128
571.22841.31246-0.08406
581.26111.301-0.0398999999999999
591.2931.30658-0.01358
601.29931.29420.00509999999999997
611.29861.272766666666670.0258333333333332

\begin{tabular}{lllllllll}
\hline
Multiple Linear Regression - Actuals, Interpolation, and Residuals \tabularnewline
Time or Index & Actuals & InterpolationForecast & ResidualsPrediction Error \tabularnewline
1 & 1.4761 & 1.45766666666667 & 0.0184333333333341 \tabularnewline
2 & 1.4721 & 1.46086 & 0.0112399999999999 \tabularnewline
3 & 1.487 & 1.44436 & 0.04264 \tabularnewline
4 & 1.5167 & 1.44712 & 0.0695799999999999 \tabularnewline
5 & 1.5812 & 1.4772 & 0.104 \tabularnewline
6 & 1.554 & 1.47804 & 0.0759600000000001 \tabularnewline
7 & 1.5508 & 1.44798 & 0.10282 \tabularnewline
8 & 1.5764 & 1.4582 & 0.1182 \tabularnewline
9 & 1.5611 & 1.46038 & 0.10072 \tabularnewline
10 & 1.4735 & 1.44892 & 0.02458 \tabularnewline
11 & 1.4303 & 1.4545 & -0.0242000000000001 \tabularnewline
12 & 1.2757 & 1.44212 & -0.16642 \tabularnewline
13 & 1.2727 & 1.42068666666667 & -0.147986666666667 \tabularnewline
14 & 1.3917 & 1.42388 & -0.0321800000000001 \tabularnewline
15 & 1.2816 & 1.40738 & -0.12578 \tabularnewline
16 & 1.2644 & 1.41014 & -0.14574 \tabularnewline
17 & 1.3308 & 1.44022 & -0.10942 \tabularnewline
18 & 1.3275 & 1.44106 & -0.11356 \tabularnewline
19 & 1.4098 & 1.411 & -0.00120000000000003 \tabularnewline
20 & 1.4134 & 1.42122 & -0.00782000000000005 \tabularnewline
21 & 1.4138 & 1.4234 & -0.00960000000000003 \tabularnewline
22 & 1.4272 & 1.41194 & 0.01526 \tabularnewline
23 & 1.4643 & 1.41752 & 0.04678 \tabularnewline
24 & 1.48 & 1.40514 & 0.07486 \tabularnewline
25 & 1.5023 & 1.38370666666667 & 0.118593333333333 \tabularnewline
26 & 1.4406 & 1.3869 & 0.0537000000000001 \tabularnewline
27 & 1.3966 & 1.3704 & 0.0262 \tabularnewline
28 & 1.357 & 1.37316 & -0.01616 \tabularnewline
29 & 1.3479 & 1.40324 & -0.0553399999999999 \tabularnewline
30 & 1.3315 & 1.40408 & -0.0725800000000001 \tabularnewline
31 & 1.2307 & 1.37402 & -0.14332 \tabularnewline
32 & 1.2271 & 1.38424 & -0.15714 \tabularnewline
33 & 1.3028 & 1.38642 & -0.08362 \tabularnewline
34 & 1.268 & 1.37496 & -0.10696 \tabularnewline
35 & 1.3648 & 1.38054 & -0.01574 \tabularnewline
36 & 1.3857 & 1.36816 & 0.01754 \tabularnewline
37 & 1.2998 & 1.34672666666667 & -0.0469266666666667 \tabularnewline
38 & 1.3362 & 1.34992 & -0.0137199999999999 \tabularnewline
39 & 1.3692 & 1.33342 & 0.0357799999999999 \tabularnewline
40 & 1.3834 & 1.33618 & 0.04722 \tabularnewline
41 & 1.4207 & 1.36626 & 0.0544400000000001 \tabularnewline
42 & 1.486 & 1.3671 & 0.1189 \tabularnewline
43 & 1.4385 & 1.33704 & 0.10146 \tabularnewline
44 & 1.4453 & 1.34726 & 0.09804 \tabularnewline
45 & 1.426 & 1.34944 & 0.07656 \tabularnewline
46 & 1.445 & 1.33798 & 0.10702 \tabularnewline
47 & 1.3503 & 1.34356 & 0.00674000000000011 \tabularnewline
48 & 1.4001 & 1.33118 & 0.0689199999999999 \tabularnewline
49 & 1.3418 & 1.30974666666667 & 0.0320533333333333 \tabularnewline
50 & 1.2939 & 1.31294 & -0.0190399999999999 \tabularnewline
51 & 1.3176 & 1.29644 & 0.0211600000000001 \tabularnewline
52 & 1.3443 & 1.2992 & 0.0451000000000001 \tabularnewline
53 & 1.3356 & 1.32928 & 0.00631999999999996 \tabularnewline
54 & 1.3214 & 1.33012 & -0.00872 \tabularnewline
55 & 1.2403 & 1.30006 & -0.0597599999999999 \tabularnewline
56 & 1.259 & 1.31028 & -0.05128 \tabularnewline
57 & 1.2284 & 1.31246 & -0.08406 \tabularnewline
58 & 1.2611 & 1.301 & -0.0398999999999999 \tabularnewline
59 & 1.293 & 1.30658 & -0.01358 \tabularnewline
60 & 1.2993 & 1.2942 & 0.00509999999999997 \tabularnewline
61 & 1.2986 & 1.27276666666667 & 0.0258333333333332 \tabularnewline
\hline
\end{tabular}
%Source: https://freestatistics.org/blog/index.php?pk=203485&T=4

[TABLE]
[ROW][C]Multiple Linear Regression - Actuals, Interpolation, and Residuals[/C][/ROW]
[ROW][C]Time or Index[/C][C]Actuals[/C][C]InterpolationForecast[/C][C]ResidualsPrediction Error[/C][/ROW]
[ROW][C]1[/C][C]1.4761[/C][C]1.45766666666667[/C][C]0.0184333333333341[/C][/ROW]
[ROW][C]2[/C][C]1.4721[/C][C]1.46086[/C][C]0.0112399999999999[/C][/ROW]
[ROW][C]3[/C][C]1.487[/C][C]1.44436[/C][C]0.04264[/C][/ROW]
[ROW][C]4[/C][C]1.5167[/C][C]1.44712[/C][C]0.0695799999999999[/C][/ROW]
[ROW][C]5[/C][C]1.5812[/C][C]1.4772[/C][C]0.104[/C][/ROW]
[ROW][C]6[/C][C]1.554[/C][C]1.47804[/C][C]0.0759600000000001[/C][/ROW]
[ROW][C]7[/C][C]1.5508[/C][C]1.44798[/C][C]0.10282[/C][/ROW]
[ROW][C]8[/C][C]1.5764[/C][C]1.4582[/C][C]0.1182[/C][/ROW]
[ROW][C]9[/C][C]1.5611[/C][C]1.46038[/C][C]0.10072[/C][/ROW]
[ROW][C]10[/C][C]1.4735[/C][C]1.44892[/C][C]0.02458[/C][/ROW]
[ROW][C]11[/C][C]1.4303[/C][C]1.4545[/C][C]-0.0242000000000001[/C][/ROW]
[ROW][C]12[/C][C]1.2757[/C][C]1.44212[/C][C]-0.16642[/C][/ROW]
[ROW][C]13[/C][C]1.2727[/C][C]1.42068666666667[/C][C]-0.147986666666667[/C][/ROW]
[ROW][C]14[/C][C]1.3917[/C][C]1.42388[/C][C]-0.0321800000000001[/C][/ROW]
[ROW][C]15[/C][C]1.2816[/C][C]1.40738[/C][C]-0.12578[/C][/ROW]
[ROW][C]16[/C][C]1.2644[/C][C]1.41014[/C][C]-0.14574[/C][/ROW]
[ROW][C]17[/C][C]1.3308[/C][C]1.44022[/C][C]-0.10942[/C][/ROW]
[ROW][C]18[/C][C]1.3275[/C][C]1.44106[/C][C]-0.11356[/C][/ROW]
[ROW][C]19[/C][C]1.4098[/C][C]1.411[/C][C]-0.00120000000000003[/C][/ROW]
[ROW][C]20[/C][C]1.4134[/C][C]1.42122[/C][C]-0.00782000000000005[/C][/ROW]
[ROW][C]21[/C][C]1.4138[/C][C]1.4234[/C][C]-0.00960000000000003[/C][/ROW]
[ROW][C]22[/C][C]1.4272[/C][C]1.41194[/C][C]0.01526[/C][/ROW]
[ROW][C]23[/C][C]1.4643[/C][C]1.41752[/C][C]0.04678[/C][/ROW]
[ROW][C]24[/C][C]1.48[/C][C]1.40514[/C][C]0.07486[/C][/ROW]
[ROW][C]25[/C][C]1.5023[/C][C]1.38370666666667[/C][C]0.118593333333333[/C][/ROW]
[ROW][C]26[/C][C]1.4406[/C][C]1.3869[/C][C]0.0537000000000001[/C][/ROW]
[ROW][C]27[/C][C]1.3966[/C][C]1.3704[/C][C]0.0262[/C][/ROW]
[ROW][C]28[/C][C]1.357[/C][C]1.37316[/C][C]-0.01616[/C][/ROW]
[ROW][C]29[/C][C]1.3479[/C][C]1.40324[/C][C]-0.0553399999999999[/C][/ROW]
[ROW][C]30[/C][C]1.3315[/C][C]1.40408[/C][C]-0.0725800000000001[/C][/ROW]
[ROW][C]31[/C][C]1.2307[/C][C]1.37402[/C][C]-0.14332[/C][/ROW]
[ROW][C]32[/C][C]1.2271[/C][C]1.38424[/C][C]-0.15714[/C][/ROW]
[ROW][C]33[/C][C]1.3028[/C][C]1.38642[/C][C]-0.08362[/C][/ROW]
[ROW][C]34[/C][C]1.268[/C][C]1.37496[/C][C]-0.10696[/C][/ROW]
[ROW][C]35[/C][C]1.3648[/C][C]1.38054[/C][C]-0.01574[/C][/ROW]
[ROW][C]36[/C][C]1.3857[/C][C]1.36816[/C][C]0.01754[/C][/ROW]
[ROW][C]37[/C][C]1.2998[/C][C]1.34672666666667[/C][C]-0.0469266666666667[/C][/ROW]
[ROW][C]38[/C][C]1.3362[/C][C]1.34992[/C][C]-0.0137199999999999[/C][/ROW]
[ROW][C]39[/C][C]1.3692[/C][C]1.33342[/C][C]0.0357799999999999[/C][/ROW]
[ROW][C]40[/C][C]1.3834[/C][C]1.33618[/C][C]0.04722[/C][/ROW]
[ROW][C]41[/C][C]1.4207[/C][C]1.36626[/C][C]0.0544400000000001[/C][/ROW]
[ROW][C]42[/C][C]1.486[/C][C]1.3671[/C][C]0.1189[/C][/ROW]
[ROW][C]43[/C][C]1.4385[/C][C]1.33704[/C][C]0.10146[/C][/ROW]
[ROW][C]44[/C][C]1.4453[/C][C]1.34726[/C][C]0.09804[/C][/ROW]
[ROW][C]45[/C][C]1.426[/C][C]1.34944[/C][C]0.07656[/C][/ROW]
[ROW][C]46[/C][C]1.445[/C][C]1.33798[/C][C]0.10702[/C][/ROW]
[ROW][C]47[/C][C]1.3503[/C][C]1.34356[/C][C]0.00674000000000011[/C][/ROW]
[ROW][C]48[/C][C]1.4001[/C][C]1.33118[/C][C]0.0689199999999999[/C][/ROW]
[ROW][C]49[/C][C]1.3418[/C][C]1.30974666666667[/C][C]0.0320533333333333[/C][/ROW]
[ROW][C]50[/C][C]1.2939[/C][C]1.31294[/C][C]-0.0190399999999999[/C][/ROW]
[ROW][C]51[/C][C]1.3176[/C][C]1.29644[/C][C]0.0211600000000001[/C][/ROW]
[ROW][C]52[/C][C]1.3443[/C][C]1.2992[/C][C]0.0451000000000001[/C][/ROW]
[ROW][C]53[/C][C]1.3356[/C][C]1.32928[/C][C]0.00631999999999996[/C][/ROW]
[ROW][C]54[/C][C]1.3214[/C][C]1.33012[/C][C]-0.00872[/C][/ROW]
[ROW][C]55[/C][C]1.2403[/C][C]1.30006[/C][C]-0.0597599999999999[/C][/ROW]
[ROW][C]56[/C][C]1.259[/C][C]1.31028[/C][C]-0.05128[/C][/ROW]
[ROW][C]57[/C][C]1.2284[/C][C]1.31246[/C][C]-0.08406[/C][/ROW]
[ROW][C]58[/C][C]1.2611[/C][C]1.301[/C][C]-0.0398999999999999[/C][/ROW]
[ROW][C]59[/C][C]1.293[/C][C]1.30658[/C][C]-0.01358[/C][/ROW]
[ROW][C]60[/C][C]1.2993[/C][C]1.2942[/C][C]0.00509999999999997[/C][/ROW]
[ROW][C]61[/C][C]1.2986[/C][C]1.27276666666667[/C][C]0.0258333333333332[/C][/ROW]
[/TABLE]
Source: https://freestatistics.org/blog/index.php?pk=203485&T=4

Globally Unique Identifier (entire table): ba.freestatistics.org/blog/index.php?pk=203485&T=4

As an alternative you can also use a QR Code:  

The GUIDs for individual cells are displayed in the table below:

Multiple Linear Regression - Actuals, Interpolation, and Residuals
Time or IndexActualsInterpolationForecastResidualsPrediction Error
11.47611.457666666666670.0184333333333341
21.47211.460860.0112399999999999
31.4871.444360.04264
41.51671.447120.0695799999999999
51.58121.47720.104
61.5541.478040.0759600000000001
71.55081.447980.10282
81.57641.45820.1182
91.56111.460380.10072
101.47351.448920.02458
111.43031.4545-0.0242000000000001
121.27571.44212-0.16642
131.27271.42068666666667-0.147986666666667
141.39171.42388-0.0321800000000001
151.28161.40738-0.12578
161.26441.41014-0.14574
171.33081.44022-0.10942
181.32751.44106-0.11356
191.40981.411-0.00120000000000003
201.41341.42122-0.00782000000000005
211.41381.4234-0.00960000000000003
221.42721.411940.01526
231.46431.417520.04678
241.481.405140.07486
251.50231.383706666666670.118593333333333
261.44061.38690.0537000000000001
271.39661.37040.0262
281.3571.37316-0.01616
291.34791.40324-0.0553399999999999
301.33151.40408-0.0725800000000001
311.23071.37402-0.14332
321.22711.38424-0.15714
331.30281.38642-0.08362
341.2681.37496-0.10696
351.36481.38054-0.01574
361.38571.368160.01754
371.29981.34672666666667-0.0469266666666667
381.33621.34992-0.0137199999999999
391.36921.333420.0357799999999999
401.38341.336180.04722
411.42071.366260.0544400000000001
421.4861.36710.1189
431.43851.337040.10146
441.44531.347260.09804
451.4261.349440.07656
461.4451.337980.10702
471.35031.343560.00674000000000011
481.40011.331180.0689199999999999
491.34181.309746666666670.0320533333333333
501.29391.31294-0.0190399999999999
511.31761.296440.0211600000000001
521.34431.29920.0451000000000001
531.33561.329280.00631999999999996
541.32141.33012-0.00872
551.24031.30006-0.0597599999999999
561.2591.31028-0.05128
571.22841.31246-0.08406
581.26111.301-0.0398999999999999
591.2931.30658-0.01358
601.29931.29420.00509999999999997
611.29861.272766666666670.0258333333333332


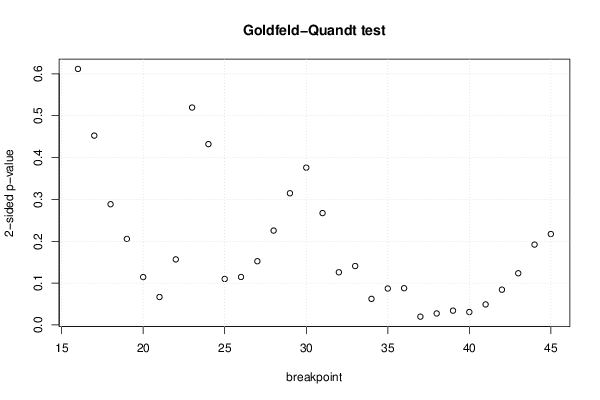
Goldfeld-Quandt test for Heteroskedasticity
p-valuesAlternative Hypothesis
breakpoint indexgreater2-sidedless
160.3058874647909340.6117749295818680.694112535209066
170.2262574992808850.4525149985617710.773742500719115
180.144228433698810.288456867397620.85577156630119
190.1027474951960390.2054949903920780.897252504803961
200.05720630073602720.1144126014720540.942793699263973
210.03336051120292220.06672102240584440.966639488797078
220.07829423528678110.1565884705735620.921705764713219
230.2597786441681110.5195572883362220.740221355831889
240.7839467328458170.4321065343083670.216053267154183
250.9450548460468450.1098903079063110.0549451539531553
260.9426898430049890.1146203139900220.0573101569950112
270.9238721231869550.1522557536260890.0761278768130447
280.887246960570380.2255060788592410.11275303942962
290.8426489210663870.3147021578672270.157351078933613
300.8120547862269970.3758904275460050.187945213773003
310.8663460725804770.2673078548390460.133653927419523
320.9370697205854410.1258605588291190.0629302794145593
330.929597630112190.140804739775620.0704023698878101
340.9688241021500860.06235179569982730.0311758978499137
350.9564679395730580.08706412085388360.0435320604269418
360.9561210433367090.08775791332658140.0438789566632907
370.9901002769621290.01979944607574220.00989972303787112
380.9862927104896790.02741457902064270.0137072895103213
390.9829556438329060.03408871233418790.017044356167094
400.9846040014094820.03079199718103630.0153959985905182
410.9754956244885860.04900875102282720.0245043755114136
420.9578744268313380.08425114633732340.0421255731686617
430.938235255778070.123529488443860.06176474422193
440.9039952939844220.1920094120311560.0960047060155778
450.8913611427425330.2172777145149340.108638857257467

\begin{tabular}{lllllllll}
\hline
Goldfeld-Quandt test for Heteroskedasticity \tabularnewline
p-values & Alternative Hypothesis \tabularnewline
breakpoint index & greater & 2-sided & less \tabularnewline
16 & 0.305887464790934 & 0.611774929581868 & 0.694112535209066 \tabularnewline
17 & 0.226257499280885 & 0.452514998561771 & 0.773742500719115 \tabularnewline
18 & 0.14422843369881 & 0.28845686739762 & 0.85577156630119 \tabularnewline
19 & 0.102747495196039 & 0.205494990392078 & 0.897252504803961 \tabularnewline
20 & 0.0572063007360272 & 0.114412601472054 & 0.942793699263973 \tabularnewline
21 & 0.0333605112029222 & 0.0667210224058444 & 0.966639488797078 \tabularnewline
22 & 0.0782942352867811 & 0.156588470573562 & 0.921705764713219 \tabularnewline
23 & 0.259778644168111 & 0.519557288336222 & 0.740221355831889 \tabularnewline
24 & 0.783946732845817 & 0.432106534308367 & 0.216053267154183 \tabularnewline
25 & 0.945054846046845 & 0.109890307906311 & 0.0549451539531553 \tabularnewline
26 & 0.942689843004989 & 0.114620313990022 & 0.0573101569950112 \tabularnewline
27 & 0.923872123186955 & 0.152255753626089 & 0.0761278768130447 \tabularnewline
28 & 0.88724696057038 & 0.225506078859241 & 0.11275303942962 \tabularnewline
29 & 0.842648921066387 & 0.314702157867227 & 0.157351078933613 \tabularnewline
30 & 0.812054786226997 & 0.375890427546005 & 0.187945213773003 \tabularnewline
31 & 0.866346072580477 & 0.267307854839046 & 0.133653927419523 \tabularnewline
32 & 0.937069720585441 & 0.125860558829119 & 0.0629302794145593 \tabularnewline
33 & 0.92959763011219 & 0.14080473977562 & 0.0704023698878101 \tabularnewline
34 & 0.968824102150086 & 0.0623517956998273 & 0.0311758978499137 \tabularnewline
35 & 0.956467939573058 & 0.0870641208538836 & 0.0435320604269418 \tabularnewline
36 & 0.956121043336709 & 0.0877579133265814 & 0.0438789566632907 \tabularnewline
37 & 0.990100276962129 & 0.0197994460757422 & 0.00989972303787112 \tabularnewline
38 & 0.986292710489679 & 0.0274145790206427 & 0.0137072895103213 \tabularnewline
39 & 0.982955643832906 & 0.0340887123341879 & 0.017044356167094 \tabularnewline
40 & 0.984604001409482 & 0.0307919971810363 & 0.0153959985905182 \tabularnewline
41 & 0.975495624488586 & 0.0490087510228272 & 0.0245043755114136 \tabularnewline
42 & 0.957874426831338 & 0.0842511463373234 & 0.0421255731686617 \tabularnewline
43 & 0.93823525577807 & 0.12352948844386 & 0.06176474422193 \tabularnewline
44 & 0.903995293984422 & 0.192009412031156 & 0.0960047060155778 \tabularnewline
45 & 0.891361142742533 & 0.217277714514934 & 0.108638857257467 \tabularnewline
\hline
\end{tabular}
%Source: https://freestatistics.org/blog/index.php?pk=203485&T=5

[TABLE]
[ROW][C]Goldfeld-Quandt test for Heteroskedasticity[/C][/ROW]
[ROW][C]p-values[/C][C]Alternative Hypothesis[/C][/ROW]
[ROW][C]breakpoint index[/C][C]greater[/C][C]2-sided[/C][C]less[/C][/ROW]
[ROW][C]16[/C][C]0.305887464790934[/C][C]0.611774929581868[/C][C]0.694112535209066[/C][/ROW]
[ROW][C]17[/C][C]0.226257499280885[/C][C]0.452514998561771[/C][C]0.773742500719115[/C][/ROW]
[ROW][C]18[/C][C]0.14422843369881[/C][C]0.28845686739762[/C][C]0.85577156630119[/C][/ROW]
[ROW][C]19[/C][C]0.102747495196039[/C][C]0.205494990392078[/C][C]0.897252504803961[/C][/ROW]
[ROW][C]20[/C][C]0.0572063007360272[/C][C]0.114412601472054[/C][C]0.942793699263973[/C][/ROW]
[ROW][C]21[/C][C]0.0333605112029222[/C][C]0.0667210224058444[/C][C]0.966639488797078[/C][/ROW]
[ROW][C]22[/C][C]0.0782942352867811[/C][C]0.156588470573562[/C][C]0.921705764713219[/C][/ROW]
[ROW][C]23[/C][C]0.259778644168111[/C][C]0.519557288336222[/C][C]0.740221355831889[/C][/ROW]
[ROW][C]24[/C][C]0.783946732845817[/C][C]0.432106534308367[/C][C]0.216053267154183[/C][/ROW]
[ROW][C]25[/C][C]0.945054846046845[/C][C]0.109890307906311[/C][C]0.0549451539531553[/C][/ROW]
[ROW][C]26[/C][C]0.942689843004989[/C][C]0.114620313990022[/C][C]0.0573101569950112[/C][/ROW]
[ROW][C]27[/C][C]0.923872123186955[/C][C]0.152255753626089[/C][C]0.0761278768130447[/C][/ROW]
[ROW][C]28[/C][C]0.88724696057038[/C][C]0.225506078859241[/C][C]0.11275303942962[/C][/ROW]
[ROW][C]29[/C][C]0.842648921066387[/C][C]0.314702157867227[/C][C]0.157351078933613[/C][/ROW]
[ROW][C]30[/C][C]0.812054786226997[/C][C]0.375890427546005[/C][C]0.187945213773003[/C][/ROW]
[ROW][C]31[/C][C]0.866346072580477[/C][C]0.267307854839046[/C][C]0.133653927419523[/C][/ROW]
[ROW][C]32[/C][C]0.937069720585441[/C][C]0.125860558829119[/C][C]0.0629302794145593[/C][/ROW]
[ROW][C]33[/C][C]0.92959763011219[/C][C]0.14080473977562[/C][C]0.0704023698878101[/C][/ROW]
[ROW][C]34[/C][C]0.968824102150086[/C][C]0.0623517956998273[/C][C]0.0311758978499137[/C][/ROW]
[ROW][C]35[/C][C]0.956467939573058[/C][C]0.0870641208538836[/C][C]0.0435320604269418[/C][/ROW]
[ROW][C]36[/C][C]0.956121043336709[/C][C]0.0877579133265814[/C][C]0.0438789566632907[/C][/ROW]
[ROW][C]37[/C][C]0.990100276962129[/C][C]0.0197994460757422[/C][C]0.00989972303787112[/C][/ROW]
[ROW][C]38[/C][C]0.986292710489679[/C][C]0.0274145790206427[/C][C]0.0137072895103213[/C][/ROW]
[ROW][C]39[/C][C]0.982955643832906[/C][C]0.0340887123341879[/C][C]0.017044356167094[/C][/ROW]
[ROW][C]40[/C][C]0.984604001409482[/C][C]0.0307919971810363[/C][C]0.0153959985905182[/C][/ROW]
[ROW][C]41[/C][C]0.975495624488586[/C][C]0.0490087510228272[/C][C]0.0245043755114136[/C][/ROW]
[ROW][C]42[/C][C]0.957874426831338[/C][C]0.0842511463373234[/C][C]0.0421255731686617[/C][/ROW]
[ROW][C]43[/C][C]0.93823525577807[/C][C]0.12352948844386[/C][C]0.06176474422193[/C][/ROW]
[ROW][C]44[/C][C]0.903995293984422[/C][C]0.192009412031156[/C][C]0.0960047060155778[/C][/ROW]
[ROW][C]45[/C][C]0.891361142742533[/C][C]0.217277714514934[/C][C]0.108638857257467[/C][/ROW]
[/TABLE]
Source: https://freestatistics.org/blog/index.php?pk=203485&T=5

Globally Unique Identifier (entire table): ba.freestatistics.org/blog/index.php?pk=203485&T=5

As an alternative you can also use a QR Code:  

The GUIDs for individual cells are displayed in the table below:

Goldfeld-Quandt test for Heteroskedasticity
p-valuesAlternative Hypothesis
breakpoint indexgreater2-sidedless
160.3058874647909340.6117749295818680.694112535209066
170.2262574992808850.4525149985617710.773742500719115
180.144228433698810.288456867397620.85577156630119
190.1027474951960390.2054949903920780.897252504803961
200.05720630073602720.1144126014720540.942793699263973
210.03336051120292220.06672102240584440.966639488797078
220.07829423528678110.1565884705735620.921705764713219
230.2597786441681110.5195572883362220.740221355831889
240.7839467328458170.4321065343083670.216053267154183
250.9450548460468450.1098903079063110.0549451539531553
260.9426898430049890.1146203139900220.0573101569950112
270.9238721231869550.1522557536260890.0761278768130447
280.887246960570380.2255060788592410.11275303942962
290.8426489210663870.3147021578672270.157351078933613
300.8120547862269970.3758904275460050.187945213773003
310.8663460725804770.2673078548390460.133653927419523
320.9370697205854410.1258605588291190.0629302794145593
330.929597630112190.140804739775620.0704023698878101
340.9688241021500860.06235179569982730.0311758978499137
350.9564679395730580.08706412085388360.0435320604269418
360.9561210433367090.08775791332658140.0438789566632907
370.9901002769621290.01979944607574220.00989972303787112
380.9862927104896790.02741457902064270.0137072895103213
390.9829556438329060.03408871233418790.017044356167094
400.9846040014094820.03079199718103630.0153959985905182
410.9754956244885860.04900875102282720.0245043755114136
420.9578744268313380.08425114633732340.0421255731686617
430.938235255778070.123529488443860.06176474422193
440.9039952939844220.1920094120311560.0960047060155778
450.8913611427425330.2172777145149340.108638857257467


Meta Analysis of Goldfeld-Quandt test for Heteroskedasticity
Description# significant tests% significant testsOK/NOK
1% type I error level00OK
5% type I error level50.166666666666667NOK
10% type I error level100.333333333333333NOK

\begin{tabular}{lllllllll}
\hline
Meta Analysis of Goldfeld-Quandt test for Heteroskedasticity \tabularnewline
Description & # significant tests & % significant tests & OK/NOK \tabularnewline
1% type I error level & 0 & 0 & OK \tabularnewline
5% type I error level & 5 & 0.166666666666667 & NOK \tabularnewline
10% type I error level & 10 & 0.333333333333333 & NOK \tabularnewline
\hline
\end{tabular}
%Source: https://freestatistics.org/blog/index.php?pk=203485&T=6

[TABLE]
[ROW][C]Meta Analysis of Goldfeld-Quandt test for Heteroskedasticity[/C][/ROW]
[ROW][C]Description[/C][C]# significant tests[/C][C]% significant tests[/C][C]OK/NOK[/C][/ROW]
[ROW][C]1% type I error level[/C][C]0[/C][C]0[/C][C]OK[/C][/ROW]
[ROW][C]5% type I error level[/C][C]5[/C][C]0.166666666666667[/C][C]NOK[/C][/ROW]
[ROW][C]10% type I error level[/C][C]10[/C][C]0.333333333333333[/C][C]NOK[/C][/ROW]
[/TABLE]
Source: https://freestatistics.org/blog/index.php?pk=203485&T=6

Globally Unique Identifier (entire table): ba.freestatistics.org/blog/index.php?pk=203485&T=6

As an alternative you can also use a QR Code:  

The GUIDs for individual cells are displayed in the table below:

Meta Analysis of Goldfeld-Quandt test for Heteroskedasticity
Description# significant tests% significant testsOK/NOK
1% type I error level00OK
5% type I error level50.166666666666667NOK
10% type I error level100.333333333333333NOK


Parameters (Session):
par1 = 1 ; par2 = Include Monthly Dummies ; par3 = Linear Trend ;
Parameters (R input):
par1 = 1 ; par2 = Include Monthly Dummies ; par3 = Linear Trend ;
R code (references can be found in the software module):
library(lattice)
library(lmtest)
n25 <- 25 #minimum number of obs. for Goldfeld-Quandt test
par1 <- as.numeric(par1)
x <- t(y)
k <- length(x[1,])
n <- length(x[,1])
x1 <- cbind(x[,par1], x[,1:k!=par1])
mycolnames <- c(colnames(x)[par1], colnames(x)[1:k!=par1])
colnames(x1) <- mycolnames #colnames(x)[par1]
x <- x1
if (par3 == 'First Differences'){
x2 <- array(0, dim=c(n-1,k), dimnames=list(1:(n-1), paste('(1-B)',colnames(x),sep='')))
for (i in 1:n-1) {
for (j in 1:k) {
x2[i,j] <- x[i+1,j] - x[i,j]
}
}
x <- x2
}
if (par2 == 'Include Monthly Dummies'){
x2 <- array(0, dim=c(n,11), dimnames=list(1:n, paste('M', seq(1:11), sep ='')))
for (i in 1:11){
x2[seq(i,n,12),i] <- 1
}
x <- cbind(x, x2)
}
if (par2 == 'Include Quarterly Dummies'){
x2 <- array(0, dim=c(n,3), dimnames=list(1:n, paste('Q', seq(1:3), sep ='')))
for (i in 1:3){
x2[seq(i,n,4),i] <- 1
}
x <- cbind(x, x2)
}
k <- length(x[1,])
if (par3 == 'Linear Trend'){
x <- cbind(x, c(1:n))
colnames(x)[k+1] <- 't'
}
x
k <- length(x[1,])
df <- as.data.frame(x)
(mylm <- lm(df))
(mysum <- summary(mylm))
if (n > n25) {
kp3 <- k + 3
nmkm3 <- n - k - 3
gqarr <- array(NA, dim=c(nmkm3-kp3+1,3))
numgqtests <- 0
numsignificant1 <- 0
numsignificant5 <- 0
numsignificant10 <- 0
for (mypoint in kp3:nmkm3) {
j <- 0
numgqtests <- numgqtests + 1
for (myalt in c('greater', 'two.sided', 'less')) {
j <- j + 1
gqarr[mypoint-kp3+1,j] <- gqtest(mylm, point=mypoint, alternative=myalt)$p.value
}
if (gqarr[mypoint-kp3+1,2] < 0.01) numsignificant1 <- numsignificant1 + 1
if (gqarr[mypoint-kp3+1,2] < 0.05) numsignificant5 <- numsignificant5 + 1
if (gqarr[mypoint-kp3+1,2] < 0.10) numsignificant10 <- numsignificant10 + 1
}
gqarr
}
bitmap(file='test0.png')
plot(x[,1], type='l', main='Actuals and Interpolation', ylab='value of Actuals and Interpolation (dots)', xlab='time or index')
points(x[,1]-mysum$resid)
grid()
dev.off()
bitmap(file='test1.png')
plot(mysum$resid, type='b', pch=19, main='Residuals', ylab='value of Residuals', xlab='time or index')
grid()
dev.off()
bitmap(file='test2.png')
hist(mysum$resid, main='Residual Histogram', xlab='values of Residuals')
grid()
dev.off()
bitmap(file='test3.png')
densityplot(~mysum$resid,col='black',main='Residual Density Plot', xlab='values of Residuals')
dev.off()
bitmap(file='test4.png')
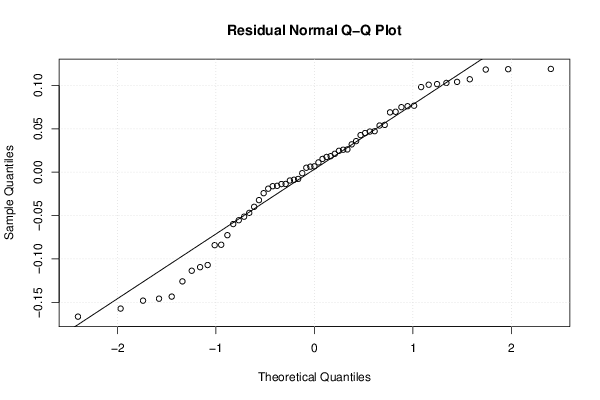
qqnorm(mysum$resid, main='Residual Normal Q-Q Plot')
qqline(mysum$resid)
grid()
dev.off()
(myerror <- as.ts(mysum$resid))
bitmap(file='test5.png')
dum <- cbind(lag(myerror,k=1),myerror)
dum
dum1 <- dum[2:length(myerror),]
dum1
z <- as.data.frame(dum1)
z
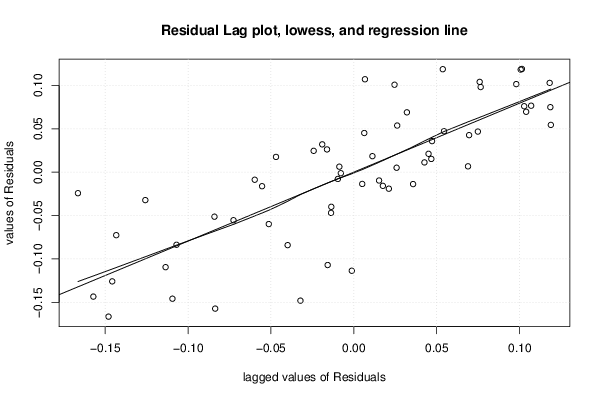
plot(z,main=paste('Residual Lag plot, lowess, and regression line'), ylab='values of Residuals', xlab='lagged values of Residuals')
lines(lowess(z))
abline(lm(z))
grid()
dev.off()
bitmap(file='test6.png')
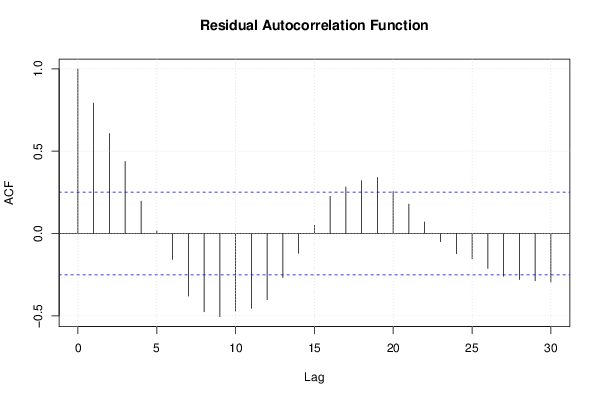
acf(mysum$resid, lag.max=length(mysum$resid)/2, main='Residual Autocorrelation Function')
grid()
dev.off()
bitmap(file='test7.png')
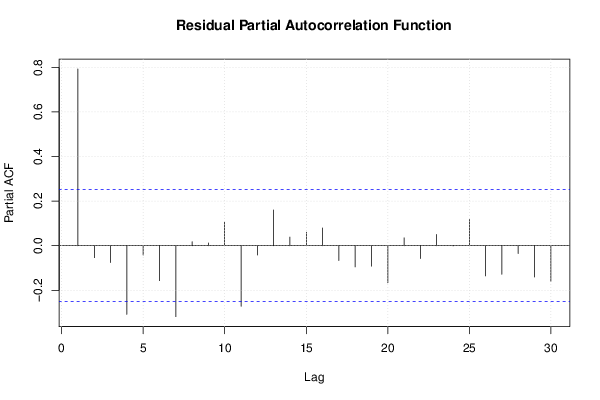
pacf(mysum$resid, lag.max=length(mysum$resid)/2, main='Residual Partial Autocorrelation Function')
grid()
dev.off()
bitmap(file='test8.png')
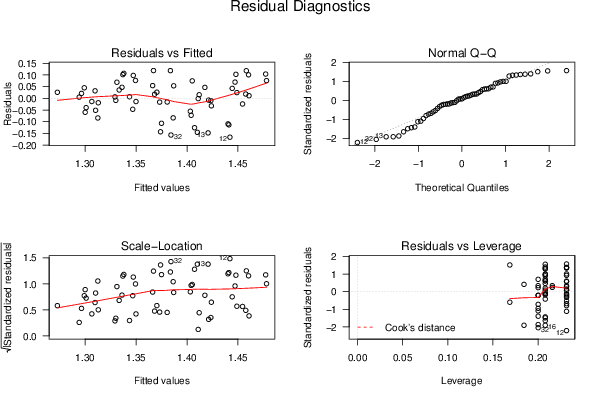
opar <- par(mfrow = c(2,2), oma = c(0, 0, 1.1, 0))
plot(mylm, las = 1, sub='Residual Diagnostics')
par(opar)
dev.off()
if (n > n25) {
bitmap(file='test9.png')
plot(kp3:nmkm3,gqarr[,2], main='Goldfeld-Quandt test',ylab='2-sided p-value',xlab='breakpoint')
grid()
dev.off()
}
load(file='createtable')
a<-table.start()
a<-table.row.start(a)
a<-table.element(a, 'Multiple Linear Regression - Estimated Regression Equation', 1, TRUE)
a<-table.row.end(a)
myeq <- colnames(x)[1]
myeq <- paste(myeq, '[t] = ', sep='')
for (i in 1:k){
if (mysum$coefficients[i,1] > 0) myeq <- paste(myeq, '+', '')
myeq <- paste(myeq, mysum$coefficients[i,1], sep=' ')
if (rownames(mysum$coefficients)[i] != '(Intercept)') {
myeq <- paste(myeq, rownames(mysum$coefficients)[i], sep='')
if (rownames(mysum$coefficients)[i] != 't') myeq <- paste(myeq, '[t]', sep='')
}
}
myeq <- paste(myeq, ' + e[t]')
a<-table.row.start(a)
a<-table.element(a, myeq)
a<-table.row.end(a)
a<-table.end(a)
table.save(a,file='mytable1.tab')
a<-table.start()
a<-table.row.start(a)
a<-table.element(a,hyperlink('ols1.htm','Multiple Linear Regression - Ordinary Least Squares',''), 6, TRUE)
a<-table.row.end(a)
a<-table.row.start(a)
a<-table.element(a,'Variable',header=TRUE)
a<-table.element(a,'Parameter',header=TRUE)
a<-table.element(a,'S.D.',header=TRUE)
a<-table.element(a,'T-STAT
H0: parameter = 0',header=TRUE)
a<-table.element(a,'2-tail p-value',header=TRUE)
a<-table.element(a,'1-tail p-value',header=TRUE)
a<-table.row.end(a)
for (i in 1:k){
a<-table.row.start(a)
a<-table.element(a,rownames(mysum$coefficients)[i],header=TRUE)
a<-table.element(a,mysum$coefficients[i,1])
a<-table.element(a, round(mysum$coefficients[i,2],6))
a<-table.element(a, round(mysum$coefficients[i,3],4))
a<-table.element(a, round(mysum$coefficients[i,4],6))
a<-table.element(a, round(mysum$coefficients[i,4]/2,6))
a<-table.row.end(a)
}
a<-table.end(a)
table.save(a,file='mytable2.tab')
a<-table.start()
a<-table.row.start(a)
a<-table.element(a, 'Multiple Linear Regression - Regression Statistics', 2, TRUE)
a<-table.row.end(a)
a<-table.row.start(a)
a<-table.element(a, 'Multiple R',1,TRUE)
a<-table.element(a, sqrt(mysum$r.squared))
a<-table.row.end(a)
a<-table.row.start(a)
a<-table.element(a, 'R-squared',1,TRUE)
a<-table.element(a, mysum$r.squared)
a<-table.row.end(a)
a<-table.row.start(a)
a<-table.element(a, 'Adjusted R-squared',1,TRUE)
a<-table.element(a, mysum$adj.r.squared)
a<-table.row.end(a)
a<-table.row.start(a)
a<-table.element(a, 'F-TEST (value)',1,TRUE)
a<-table.element(a, mysum$fstatistic[1])
a<-table.row.end(a)
a<-table.row.start(a)
a<-table.element(a, 'F-TEST (DF numerator)',1,TRUE)
a<-table.element(a, mysum$fstatistic[2])
a<-table.row.end(a)
a<-table.row.start(a)
a<-table.element(a, 'F-TEST (DF denominator)',1,TRUE)
a<-table.element(a, mysum$fstatistic[3])
a<-table.row.end(a)
a<-table.row.start(a)
a<-table.element(a, 'p-value',1,TRUE)
a<-table.element(a, 1-pf(mysum$fstatistic[1],mysum$fstatistic[2],mysum$fstatistic[3]))
a<-table.row.end(a)
a<-table.row.start(a)
a<-table.element(a, 'Multiple Linear Regression - Residual Statistics', 2, TRUE)
a<-table.row.end(a)
a<-table.row.start(a)
a<-table.element(a, 'Residual Standard Deviation',1,TRUE)
a<-table.element(a, mysum$sigma)
a<-table.row.end(a)
a<-table.row.start(a)
a<-table.element(a, 'Sum Squared Residuals',1,TRUE)
a<-table.element(a, sum(myerror*myerror))
a<-table.row.end(a)
a<-table.end(a)
table.save(a,file='mytable3.tab')
a<-table.start()
a<-table.row.start(a)
a<-table.element(a, 'Multiple Linear Regression - Actuals, Interpolation, and Residuals', 4, TRUE)
a<-table.row.end(a)
a<-table.row.start(a)
a<-table.element(a, 'Time or Index', 1, TRUE)
a<-table.element(a, 'Actuals', 1, TRUE)
a<-table.element(a, 'Interpolation
Forecast', 1, TRUE)
a<-table.element(a, 'Residuals
Prediction Error', 1, TRUE)
a<-table.row.end(a)
for (i in 1:n) {
a<-table.row.start(a)
a<-table.element(a,i, 1, TRUE)
a<-table.element(a,x[i])
a<-table.element(a,x[i]-mysum$resid[i])
a<-table.element(a,mysum$resid[i])
a<-table.row.end(a)
}
a<-table.end(a)
table.save(a,file='mytable4.tab')
if (n > n25) {
a<-table.start()
a<-table.row.start(a)
a<-table.element(a,'Goldfeld-Quandt test for Heteroskedasticity',4,TRUE)
a<-table.row.end(a)
a<-table.row.start(a)
a<-table.element(a,'p-values',header=TRUE)
a<-table.element(a,'Alternative Hypothesis',3,header=TRUE)
a<-table.row.end(a)
a<-table.row.start(a)
a<-table.element(a,'breakpoint index',header=TRUE)
a<-table.element(a,'greater',header=TRUE)
a<-table.element(a,'2-sided',header=TRUE)
a<-table.element(a,'less',header=TRUE)
a<-table.row.end(a)
for (mypoint in kp3:nmkm3) {
a<-table.row.start(a)
a<-table.element(a,mypoint,header=TRUE)
a<-table.element(a,gqarr[mypoint-kp3+1,1])
a<-table.element(a,gqarr[mypoint-kp3+1,2])
a<-table.element(a,gqarr[mypoint-kp3+1,3])
a<-table.row.end(a)
}
a<-table.end(a)
table.save(a,file='mytable5.tab')
a<-table.start()
a<-table.row.start(a)
a<-table.element(a,'Meta Analysis of Goldfeld-Quandt test for Heteroskedasticity',4,TRUE)
a<-table.row.end(a)
a<-table.row.start(a)
a<-table.element(a,'Description',header=TRUE)
a<-table.element(a,'# significant tests',header=TRUE)
a<-table.element(a,'% significant tests',header=TRUE)
a<-table.element(a,'OK/NOK',header=TRUE)
a<-table.row.end(a)
a<-table.row.start(a)
a<-table.element(a,'1% type I error level',header=TRUE)
a<-table.element(a,numsignificant1)
a<-table.element(a,numsignificant1/numgqtests)
if (numsignificant1/numgqtests < 0.01) dum <- 'OK' else dum <- 'NOK'
a<-table.element(a,dum)
a<-table.row.end(a)
a<-table.row.start(a)
a<-table.element(a,'5% type I error level',header=TRUE)
a<-table.element(a,numsignificant5)
a<-table.element(a,numsignificant5/numgqtests)
if (numsignificant5/numgqtests < 0.05) dum <- 'OK' else dum <- 'NOK'
a<-table.element(a,dum)
a<-table.row.end(a)
a<-table.row.start(a)
a<-table.element(a,'10% type I error level',header=TRUE)
a<-table.element(a,numsignificant10)
a<-table.element(a,numsignificant10/numgqtests)
if (numsignificant10/numgqtests < 0.1) dum <- 'OK' else dum <- 'NOK'
a<-table.element(a,dum)
a<-table.row.end(a)
a<-table.end(a)
table.save(a,file='mytable6.tab')
}