| Tabulation of Results | ||
| T40enT20 x CorrectAnalysis | ||
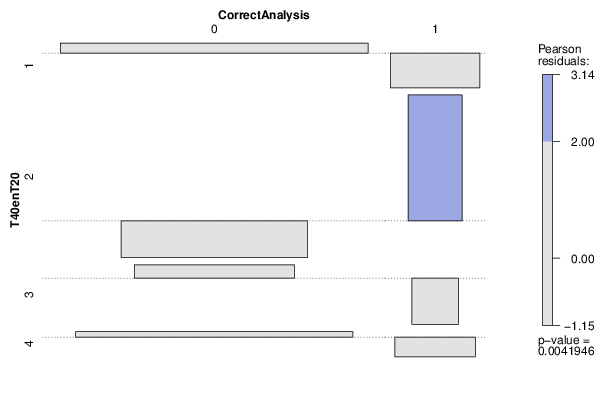
| 0 | 1 | 1 | 60 | 3 | 2 | 17 | 6 | 3 | 17 | 0 | 4 | 48 | 3 |
| Tabulation of Expected Results | ||
| T40enT20 x CorrectAnalysis | ||
| 0 | 1 | 1 | 58.09 | 4.91 | 2 | 21.21 | 1.79 | 3 | 15.68 | 1.32 | 4 | 47.03 | 3.97 |
| Statistical Results | |
| Pearson's Chi-squared test | |
| Pearson Chi Square Statistic | 13.21 |
| Degrees of Freedom | 3 |
| P value | 0 |