| Tabulation of Results | ||
| T20 x Outcome | ||
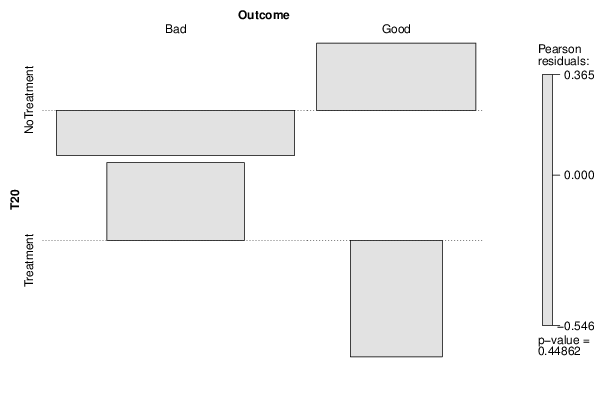
| Bad | Good | NoTreatment | 34 | 17 | Treatment | 13 | 4 |
| Tabulation of Expected Results | ||
| T20 x Outcome | ||
| Bad | Good | NoTreatment | 35.25 | 15.75 | Treatment | 11.75 | 5.25 |
| Statistical Results | |
| Pearson's Chi-squared test with simulated p-value (based on 2000 replicates) | |
| Exact Pearson Chi Square Statistic | 0.57 |
| P value | 0.53 |