Free Statistics

of Irreproducible Research!

Author's title

Author*Unverified author*
R Software Modulerwasp_exponentialsmoothing.wasp
Title produced by softwareExponential Smoothing
Date of computationFri, 21 Dec 2012 04:10:22 -0500
Cite this page as followsStatistical Computations at FreeStatistics.org, Office for Research Development and Education, URL https://freestatistics.org/blog/index.php?v=date/2012/Dec/21/t1356081160hk9dt9luj8juv99.htm/, Retrieved Thu, 25 Apr 2024 13:26:08 +0000
Statistical Computations at FreeStatistics.org, Office for Research Development and Education, URL https://freestatistics.org/blog/index.php?pk=203335, Retrieved Thu, 25 Apr 2024 13:26:08 +0000
QR Codes:

Original text written by user:
IsPrivate?No (this computation is public)
User-defined keywords
Estimated Impact75
Family? (F = Feedback message, R = changed R code, M = changed R Module, P = changed Parameters, D = changed Data)
-       [Exponential Smoothing] [Eigen reeks multi...] [2012-12-21 09:10:22] [56be9a844975c6d0d36e88eaea5fb75b] [Current]
Feedback Forum

Post a new message
Dataseries X:
45,3
49,9
53,8
55,1
52,9
53,5
53,8
52
48,2
45,5
45,7
52,5
52,3
54,8
54,7
54,9
54,9
64,2
66,4
69,1
68,3
77,3
89,6
93
96,1
131,3
125,3
126
138,3
163
182,5
164,6
148,8
109,3
93,5
80,2
84
75,5
62,4
64,2
64,7
71
73,7
72,6
68,1
72,3
78,5
81,9
97,8
93,1
94,2
101,1
101
99,7
97,1
91,7
95
98,9
109
121,9
131,5
128,5
128,4
126,4
123,1
123
123,3
123,6
124,9
120,4
114,9
113,4


Summary of computational transaction
Raw Inputview raw input (R code)
Raw Outputview raw output of R engine
Computing time4 seconds
R Server'Gwilym Jenkins' @ jenkins.wessa.net

\begin{tabular}{lllllllll}
\hline
Summary of computational transaction \tabularnewline
Raw Input & view raw input (R code)  \tabularnewline
Raw Output & view raw output of R engine  \tabularnewline
Computing time & 4 seconds \tabularnewline
R Server & 'Gwilym Jenkins' @ jenkins.wessa.net \tabularnewline
\hline
\end{tabular}
%Source: https://freestatistics.org/blog/index.php?pk=203335&T=0

[TABLE]
[ROW][C]Summary of computational transaction[/C][/ROW]
[ROW][C]Raw Input[/C][C]view raw input (R code) [/C][/ROW]
[ROW][C]Raw Output[/C][C]view raw output of R engine [/C][/ROW]
[ROW][C]Computing time[/C][C]4 seconds[/C][/ROW]
[ROW][C]R Server[/C][C]'Gwilym Jenkins' @ jenkins.wessa.net[/C][/ROW]
[/TABLE]
Source: https://freestatistics.org/blog/index.php?pk=203335&T=0

Globally Unique Identifier (entire table): ba.freestatistics.org/blog/index.php?pk=203335&T=0

As an alternative you can also use a QR Code:  

The GUIDs for individual cells are displayed in the table below:

Summary of computational transaction
Raw Inputview raw input (R code)
Raw Outputview raw output of R engine
Computing time4 seconds
R Server'Gwilym Jenkins' @ jenkins.wessa.net


Estimated Parameters of Exponential Smoothing
ParameterValue
alpha1
beta0
gamma0

\begin{tabular}{lllllllll}
\hline
Estimated Parameters of Exponential Smoothing \tabularnewline
Parameter & Value \tabularnewline
alpha & 1 \tabularnewline
beta & 0 \tabularnewline
gamma & 0 \tabularnewline
\hline
\end{tabular}
%Source: https://freestatistics.org/blog/index.php?pk=203335&T=1

[TABLE]
[ROW][C]Estimated Parameters of Exponential Smoothing[/C][/ROW]
[ROW][C]Parameter[/C][C]Value[/C][/ROW]
[ROW][C]alpha[/C][C]1[/C][/ROW]
[ROW][C]beta[/C][C]0[/C][/ROW]
[ROW][C]gamma[/C][C]0[/C][/ROW]
[/TABLE]
Source: https://freestatistics.org/blog/index.php?pk=203335&T=1

Globally Unique Identifier (entire table): ba.freestatistics.org/blog/index.php?pk=203335&T=1

As an alternative you can also use a QR Code:  

The GUIDs for individual cells are displayed in the table below:

Estimated Parameters of Exponential Smoothing
ParameterValue
alpha1
beta0
gamma0


Interpolation Forecasts of Exponential Smoothing
tObservedFittedResiduals
1352.349.67995275963352.62004724036645
1454.854.72496942726260.0750305727374254
1554.754.32249664810880.377503351891185
1654.953.95806865385530.941931346144727
1754.953.12005508822411.77994491177586
1864.261.87287231833872.32712768166127
1966.469.7635402376585-3.36354023765854
2069.164.73495002479834.36504997520166
2168.364.83488366263883.46511633736121
2277.365.460257662438111.8397423375619
2389.678.552946859384811.0470531406152
2493103.05785050721-10.0578505072102
2596.192.09937868658114.00062131341885
26131.399.577612856625631.7223871433744
27125.3128.573275431166-3.27327543116628
28126122.1863861302923.81361386970782
29138.3120.56883061227317.7311693877273
30163154.1191549461288.88084505387184
31182.5175.2368374223097.26316257769133
32164.6175.86955814642-11.2695581464201
33148.8152.94235392785-4.14235392785014
34109.3141.408085788388-32.1080857883883
3593.5110.647085464427-17.1470854644272
3680.2107.492865210349-27.2928652103492
378479.58032553008884.41967446991121
3875.587.1868141010253-11.6868141010253
3962.474.4138838482303-12.0138838482303
4064.261.39940072989732.80059927010275
4164.761.94246876436552.75753123563449
427172.7123635623716-1.71236356237156
4373.777.0228359953065-3.32283599530653
4472.671.72274192219580.877258077804242
4568.168.06395325351040.0360467464895891
4672.365.27156740622467.02843259377542
4778.573.53823770234694.9617622976531
4881.990.4351163521221-8.53511635212205
4997.881.243012277435416.5569877225646
5093.1101.31846888014-8.2184688801397
5194.291.49641596041082.70358403958922
52101.192.13113579718758.96886420281247
5310196.94752947937814.05247052062194
5499.7112.862723986697-13.1627239866972
5597.1107.661334266556-10.5613342665561
5691.794.1219652645381-2.42196526453812
579585.68544730655279.31455269344731
5898.990.65040686694588.24959313305419
59109100.2164904177888.78350958221156
60121.9125.119205697184-3.21920569718398
61131.5120.36505339147411.134946608526
62128.5135.828379463919-7.32837946391902
63128.4125.8555998678652.54440013213519
64126.4125.1822470959711.21775290402859
65123.1120.948289265012.15171073499003
66123137.306882812526-14.3068828125262
67123.3132.535097671438-9.23509767143817
68123.6119.2014375538274.39856244617255
69124.9115.1161101490689.78388985093169
70120.4118.859600170871.54039982912984
71114.9121.779739793051-6.87973979305131
72113.4131.828586914753-18.4285869147533

\begin{tabular}{lllllllll}
\hline
Interpolation Forecasts of Exponential Smoothing \tabularnewline
t & Observed & Fitted & Residuals \tabularnewline
13 & 52.3 & 49.6799527596335 & 2.62004724036645 \tabularnewline
14 & 54.8 & 54.7249694272626 & 0.0750305727374254 \tabularnewline
15 & 54.7 & 54.3224966481088 & 0.377503351891185 \tabularnewline
16 & 54.9 & 53.9580686538553 & 0.941931346144727 \tabularnewline
17 & 54.9 & 53.1200550882241 & 1.77994491177586 \tabularnewline
18 & 64.2 & 61.8728723183387 & 2.32712768166127 \tabularnewline
19 & 66.4 & 69.7635402376585 & -3.36354023765854 \tabularnewline
20 & 69.1 & 64.7349500247983 & 4.36504997520166 \tabularnewline
21 & 68.3 & 64.8348836626388 & 3.46511633736121 \tabularnewline
22 & 77.3 & 65.4602576624381 & 11.8397423375619 \tabularnewline
23 & 89.6 & 78.5529468593848 & 11.0470531406152 \tabularnewline
24 & 93 & 103.05785050721 & -10.0578505072102 \tabularnewline
25 & 96.1 & 92.0993786865811 & 4.00062131341885 \tabularnewline
26 & 131.3 & 99.5776128566256 & 31.7223871433744 \tabularnewline
27 & 125.3 & 128.573275431166 & -3.27327543116628 \tabularnewline
28 & 126 & 122.186386130292 & 3.81361386970782 \tabularnewline
29 & 138.3 & 120.568830612273 & 17.7311693877273 \tabularnewline
30 & 163 & 154.119154946128 & 8.88084505387184 \tabularnewline
31 & 182.5 & 175.236837422309 & 7.26316257769133 \tabularnewline
32 & 164.6 & 175.86955814642 & -11.2695581464201 \tabularnewline
33 & 148.8 & 152.94235392785 & -4.14235392785014 \tabularnewline
34 & 109.3 & 141.408085788388 & -32.1080857883883 \tabularnewline
35 & 93.5 & 110.647085464427 & -17.1470854644272 \tabularnewline
36 & 80.2 & 107.492865210349 & -27.2928652103492 \tabularnewline
37 & 84 & 79.5803255300888 & 4.41967446991121 \tabularnewline
38 & 75.5 & 87.1868141010253 & -11.6868141010253 \tabularnewline
39 & 62.4 & 74.4138838482303 & -12.0138838482303 \tabularnewline
40 & 64.2 & 61.3994007298973 & 2.80059927010275 \tabularnewline
41 & 64.7 & 61.9424687643655 & 2.75753123563449 \tabularnewline
42 & 71 & 72.7123635623716 & -1.71236356237156 \tabularnewline
43 & 73.7 & 77.0228359953065 & -3.32283599530653 \tabularnewline
44 & 72.6 & 71.7227419221958 & 0.877258077804242 \tabularnewline
45 & 68.1 & 68.0639532535104 & 0.0360467464895891 \tabularnewline
46 & 72.3 & 65.2715674062246 & 7.02843259377542 \tabularnewline
47 & 78.5 & 73.5382377023469 & 4.9617622976531 \tabularnewline
48 & 81.9 & 90.4351163521221 & -8.53511635212205 \tabularnewline
49 & 97.8 & 81.2430122774354 & 16.5569877225646 \tabularnewline
50 & 93.1 & 101.31846888014 & -8.2184688801397 \tabularnewline
51 & 94.2 & 91.4964159604108 & 2.70358403958922 \tabularnewline
52 & 101.1 & 92.1311357971875 & 8.96886420281247 \tabularnewline
53 & 101 & 96.9475294793781 & 4.05247052062194 \tabularnewline
54 & 99.7 & 112.862723986697 & -13.1627239866972 \tabularnewline
55 & 97.1 & 107.661334266556 & -10.5613342665561 \tabularnewline
56 & 91.7 & 94.1219652645381 & -2.42196526453812 \tabularnewline
57 & 95 & 85.6854473065527 & 9.31455269344731 \tabularnewline
58 & 98.9 & 90.6504068669458 & 8.24959313305419 \tabularnewline
59 & 109 & 100.216490417788 & 8.78350958221156 \tabularnewline
60 & 121.9 & 125.119205697184 & -3.21920569718398 \tabularnewline
61 & 131.5 & 120.365053391474 & 11.134946608526 \tabularnewline
62 & 128.5 & 135.828379463919 & -7.32837946391902 \tabularnewline
63 & 128.4 & 125.855599867865 & 2.54440013213519 \tabularnewline
64 & 126.4 & 125.182247095971 & 1.21775290402859 \tabularnewline
65 & 123.1 & 120.94828926501 & 2.15171073499003 \tabularnewline
66 & 123 & 137.306882812526 & -14.3068828125262 \tabularnewline
67 & 123.3 & 132.535097671438 & -9.23509767143817 \tabularnewline
68 & 123.6 & 119.201437553827 & 4.39856244617255 \tabularnewline
69 & 124.9 & 115.116110149068 & 9.78388985093169 \tabularnewline
70 & 120.4 & 118.85960017087 & 1.54039982912984 \tabularnewline
71 & 114.9 & 121.779739793051 & -6.87973979305131 \tabularnewline
72 & 113.4 & 131.828586914753 & -18.4285869147533 \tabularnewline
\hline
\end{tabular}
%Source: https://freestatistics.org/blog/index.php?pk=203335&T=2

[TABLE]
[ROW][C]Interpolation Forecasts of Exponential Smoothing[/C][/ROW]
[ROW][C]t[/C][C]Observed[/C][C]Fitted[/C][C]Residuals[/C][/ROW]
[ROW][C]13[/C][C]52.3[/C][C]49.6799527596335[/C][C]2.62004724036645[/C][/ROW]
[ROW][C]14[/C][C]54.8[/C][C]54.7249694272626[/C][C]0.0750305727374254[/C][/ROW]
[ROW][C]15[/C][C]54.7[/C][C]54.3224966481088[/C][C]0.377503351891185[/C][/ROW]
[ROW][C]16[/C][C]54.9[/C][C]53.9580686538553[/C][C]0.941931346144727[/C][/ROW]
[ROW][C]17[/C][C]54.9[/C][C]53.1200550882241[/C][C]1.77994491177586[/C][/ROW]
[ROW][C]18[/C][C]64.2[/C][C]61.8728723183387[/C][C]2.32712768166127[/C][/ROW]
[ROW][C]19[/C][C]66.4[/C][C]69.7635402376585[/C][C]-3.36354023765854[/C][/ROW]
[ROW][C]20[/C][C]69.1[/C][C]64.7349500247983[/C][C]4.36504997520166[/C][/ROW]
[ROW][C]21[/C][C]68.3[/C][C]64.8348836626388[/C][C]3.46511633736121[/C][/ROW]
[ROW][C]22[/C][C]77.3[/C][C]65.4602576624381[/C][C]11.8397423375619[/C][/ROW]
[ROW][C]23[/C][C]89.6[/C][C]78.5529468593848[/C][C]11.0470531406152[/C][/ROW]
[ROW][C]24[/C][C]93[/C][C]103.05785050721[/C][C]-10.0578505072102[/C][/ROW]
[ROW][C]25[/C][C]96.1[/C][C]92.0993786865811[/C][C]4.00062131341885[/C][/ROW]
[ROW][C]26[/C][C]131.3[/C][C]99.5776128566256[/C][C]31.7223871433744[/C][/ROW]
[ROW][C]27[/C][C]125.3[/C][C]128.573275431166[/C][C]-3.27327543116628[/C][/ROW]
[ROW][C]28[/C][C]126[/C][C]122.186386130292[/C][C]3.81361386970782[/C][/ROW]
[ROW][C]29[/C][C]138.3[/C][C]120.568830612273[/C][C]17.7311693877273[/C][/ROW]
[ROW][C]30[/C][C]163[/C][C]154.119154946128[/C][C]8.88084505387184[/C][/ROW]
[ROW][C]31[/C][C]182.5[/C][C]175.236837422309[/C][C]7.26316257769133[/C][/ROW]
[ROW][C]32[/C][C]164.6[/C][C]175.86955814642[/C][C]-11.2695581464201[/C][/ROW]
[ROW][C]33[/C][C]148.8[/C][C]152.94235392785[/C][C]-4.14235392785014[/C][/ROW]
[ROW][C]34[/C][C]109.3[/C][C]141.408085788388[/C][C]-32.1080857883883[/C][/ROW]
[ROW][C]35[/C][C]93.5[/C][C]110.647085464427[/C][C]-17.1470854644272[/C][/ROW]
[ROW][C]36[/C][C]80.2[/C][C]107.492865210349[/C][C]-27.2928652103492[/C][/ROW]
[ROW][C]37[/C][C]84[/C][C]79.5803255300888[/C][C]4.41967446991121[/C][/ROW]
[ROW][C]38[/C][C]75.5[/C][C]87.1868141010253[/C][C]-11.6868141010253[/C][/ROW]
[ROW][C]39[/C][C]62.4[/C][C]74.4138838482303[/C][C]-12.0138838482303[/C][/ROW]
[ROW][C]40[/C][C]64.2[/C][C]61.3994007298973[/C][C]2.80059927010275[/C][/ROW]
[ROW][C]41[/C][C]64.7[/C][C]61.9424687643655[/C][C]2.75753123563449[/C][/ROW]
[ROW][C]42[/C][C]71[/C][C]72.7123635623716[/C][C]-1.71236356237156[/C][/ROW]
[ROW][C]43[/C][C]73.7[/C][C]77.0228359953065[/C][C]-3.32283599530653[/C][/ROW]
[ROW][C]44[/C][C]72.6[/C][C]71.7227419221958[/C][C]0.877258077804242[/C][/ROW]
[ROW][C]45[/C][C]68.1[/C][C]68.0639532535104[/C][C]0.0360467464895891[/C][/ROW]
[ROW][C]46[/C][C]72.3[/C][C]65.2715674062246[/C][C]7.02843259377542[/C][/ROW]
[ROW][C]47[/C][C]78.5[/C][C]73.5382377023469[/C][C]4.9617622976531[/C][/ROW]
[ROW][C]48[/C][C]81.9[/C][C]90.4351163521221[/C][C]-8.53511635212205[/C][/ROW]
[ROW][C]49[/C][C]97.8[/C][C]81.2430122774354[/C][C]16.5569877225646[/C][/ROW]
[ROW][C]50[/C][C]93.1[/C][C]101.31846888014[/C][C]-8.2184688801397[/C][/ROW]
[ROW][C]51[/C][C]94.2[/C][C]91.4964159604108[/C][C]2.70358403958922[/C][/ROW]
[ROW][C]52[/C][C]101.1[/C][C]92.1311357971875[/C][C]8.96886420281247[/C][/ROW]
[ROW][C]53[/C][C]101[/C][C]96.9475294793781[/C][C]4.05247052062194[/C][/ROW]
[ROW][C]54[/C][C]99.7[/C][C]112.862723986697[/C][C]-13.1627239866972[/C][/ROW]
[ROW][C]55[/C][C]97.1[/C][C]107.661334266556[/C][C]-10.5613342665561[/C][/ROW]
[ROW][C]56[/C][C]91.7[/C][C]94.1219652645381[/C][C]-2.42196526453812[/C][/ROW]
[ROW][C]57[/C][C]95[/C][C]85.6854473065527[/C][C]9.31455269344731[/C][/ROW]
[ROW][C]58[/C][C]98.9[/C][C]90.6504068669458[/C][C]8.24959313305419[/C][/ROW]
[ROW][C]59[/C][C]109[/C][C]100.216490417788[/C][C]8.78350958221156[/C][/ROW]
[ROW][C]60[/C][C]121.9[/C][C]125.119205697184[/C][C]-3.21920569718398[/C][/ROW]
[ROW][C]61[/C][C]131.5[/C][C]120.365053391474[/C][C]11.134946608526[/C][/ROW]
[ROW][C]62[/C][C]128.5[/C][C]135.828379463919[/C][C]-7.32837946391902[/C][/ROW]
[ROW][C]63[/C][C]128.4[/C][C]125.855599867865[/C][C]2.54440013213519[/C][/ROW]
[ROW][C]64[/C][C]126.4[/C][C]125.182247095971[/C][C]1.21775290402859[/C][/ROW]
[ROW][C]65[/C][C]123.1[/C][C]120.94828926501[/C][C]2.15171073499003[/C][/ROW]
[ROW][C]66[/C][C]123[/C][C]137.306882812526[/C][C]-14.3068828125262[/C][/ROW]
[ROW][C]67[/C][C]123.3[/C][C]132.535097671438[/C][C]-9.23509767143817[/C][/ROW]
[ROW][C]68[/C][C]123.6[/C][C]119.201437553827[/C][C]4.39856244617255[/C][/ROW]
[ROW][C]69[/C][C]124.9[/C][C]115.116110149068[/C][C]9.78388985093169[/C][/ROW]
[ROW][C]70[/C][C]120.4[/C][C]118.85960017087[/C][C]1.54039982912984[/C][/ROW]
[ROW][C]71[/C][C]114.9[/C][C]121.779739793051[/C][C]-6.87973979305131[/C][/ROW]
[ROW][C]72[/C][C]113.4[/C][C]131.828586914753[/C][C]-18.4285869147533[/C][/ROW]
[/TABLE]
Source: https://freestatistics.org/blog/index.php?pk=203335&T=2

Globally Unique Identifier (entire table): ba.freestatistics.org/blog/index.php?pk=203335&T=2

As an alternative you can also use a QR Code:  

The GUIDs for individual cells are displayed in the table below:

Interpolation Forecasts of Exponential Smoothing
tObservedFittedResiduals
1352.349.67995275963352.62004724036645
1454.854.72496942726260.0750305727374254
1554.754.32249664810880.377503351891185
1654.953.95806865385530.941931346144727
1754.953.12005508822411.77994491177586
1864.261.87287231833872.32712768166127
1966.469.7635402376585-3.36354023765854
2069.164.73495002479834.36504997520166
2168.364.83488366263883.46511633736121
2277.365.460257662438111.8397423375619
2389.678.552946859384811.0470531406152
2493103.05785050721-10.0578505072102
2596.192.09937868658114.00062131341885
26131.399.577612856625631.7223871433744
27125.3128.573275431166-3.27327543116628
28126122.1863861302923.81361386970782
29138.3120.56883061227317.7311693877273
30163154.1191549461288.88084505387184
31182.5175.2368374223097.26316257769133
32164.6175.86955814642-11.2695581464201
33148.8152.94235392785-4.14235392785014
34109.3141.408085788388-32.1080857883883
3593.5110.647085464427-17.1470854644272
3680.2107.492865210349-27.2928652103492
378479.58032553008884.41967446991121
3875.587.1868141010253-11.6868141010253
3962.474.4138838482303-12.0138838482303
4064.261.39940072989732.80059927010275
4164.761.94246876436552.75753123563449
427172.7123635623716-1.71236356237156
4373.777.0228359953065-3.32283599530653
4472.671.72274192219580.877258077804242
4568.168.06395325351040.0360467464895891
4672.365.27156740622467.02843259377542
4778.573.53823770234694.9617622976531
4881.990.4351163521221-8.53511635212205
4997.881.243012277435416.5569877225646
5093.1101.31846888014-8.2184688801397
5194.291.49641596041082.70358403958922
52101.192.13113579718758.96886420281247
5310196.94752947937814.05247052062194
5499.7112.862723986697-13.1627239866972
5597.1107.661334266556-10.5613342665561
5691.794.1219652645381-2.42196526453812
579585.68544730655279.31455269344731
5898.990.65040686694588.24959313305419
59109100.2164904177888.78350958221156
60121.9125.119205697184-3.21920569718398
61131.5120.36505339147411.134946608526
62128.5135.828379463919-7.32837946391902
63128.4125.8555998678652.54440013213519
64126.4125.1822470959711.21775290402859
65123.1120.948289265012.15171073499003
66123137.306882812526-14.3068828125262
67123.3132.535097671438-9.23509767143817
68123.6119.2014375538274.39856244617255
69124.9115.1161101490689.78388985093169
70120.4118.859600170871.54039982912984
71114.9121.779739793051-6.87973979305131
72113.4131.828586914753-18.4285869147533


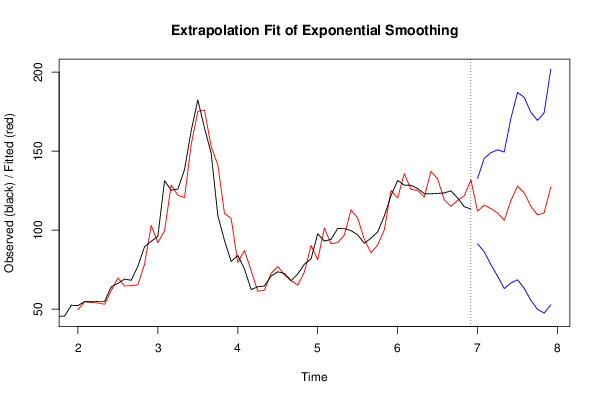
Extrapolation Forecasts of Exponential Smoothing
tForecast95% Lower Bound95% Upper Bound
73112.05161965474191.3722683951888132.730970914293
74115.91259706883886.3140696596721145.511124478004
75113.63828652806278.2412547484588149.035318307665
76110.91642736141770.9437103483872150.889144374446
77106.25985023251963.0677131409036149.451987324134
78118.68048934795466.623331666994170.737647028913
79127.92383217856868.6277529069972187.219911450139
80123.62751659935163.2177204777596184.037312720943
81115.14149672455755.6951805796439174.58781286947
82109.6529277543549.8772680527437169.428587455956
83111.00105147272947.5832379374112174.418865008048
84127.39476792879852.7488380697567202.040697787838

\begin{tabular}{lllllllll}
\hline
Extrapolation Forecasts of Exponential Smoothing \tabularnewline
t & Forecast & 95% Lower Bound & 95% Upper Bound \tabularnewline
73 & 112.051619654741 & 91.3722683951888 & 132.730970914293 \tabularnewline
74 & 115.912597068838 & 86.3140696596721 & 145.511124478004 \tabularnewline
75 & 113.638286528062 & 78.2412547484588 & 149.035318307665 \tabularnewline
76 & 110.916427361417 & 70.9437103483872 & 150.889144374446 \tabularnewline
77 & 106.259850232519 & 63.0677131409036 & 149.451987324134 \tabularnewline
78 & 118.680489347954 & 66.623331666994 & 170.737647028913 \tabularnewline
79 & 127.923832178568 & 68.6277529069972 & 187.219911450139 \tabularnewline
80 & 123.627516599351 & 63.2177204777596 & 184.037312720943 \tabularnewline
81 & 115.141496724557 & 55.6951805796439 & 174.58781286947 \tabularnewline
82 & 109.65292775435 & 49.8772680527437 & 169.428587455956 \tabularnewline
83 & 111.001051472729 & 47.5832379374112 & 174.418865008048 \tabularnewline
84 & 127.394767928798 & 52.7488380697567 & 202.040697787838 \tabularnewline
\hline
\end{tabular}
%Source: https://freestatistics.org/blog/index.php?pk=203335&T=3

[TABLE]
[ROW][C]Extrapolation Forecasts of Exponential Smoothing[/C][/ROW]
[ROW][C]t[/C][C]Forecast[/C][C]95% Lower Bound[/C][C]95% Upper Bound[/C][/ROW]
[ROW][C]73[/C][C]112.051619654741[/C][C]91.3722683951888[/C][C]132.730970914293[/C][/ROW]
[ROW][C]74[/C][C]115.912597068838[/C][C]86.3140696596721[/C][C]145.511124478004[/C][/ROW]
[ROW][C]75[/C][C]113.638286528062[/C][C]78.2412547484588[/C][C]149.035318307665[/C][/ROW]
[ROW][C]76[/C][C]110.916427361417[/C][C]70.9437103483872[/C][C]150.889144374446[/C][/ROW]
[ROW][C]77[/C][C]106.259850232519[/C][C]63.0677131409036[/C][C]149.451987324134[/C][/ROW]
[ROW][C]78[/C][C]118.680489347954[/C][C]66.623331666994[/C][C]170.737647028913[/C][/ROW]
[ROW][C]79[/C][C]127.923832178568[/C][C]68.6277529069972[/C][C]187.219911450139[/C][/ROW]
[ROW][C]80[/C][C]123.627516599351[/C][C]63.2177204777596[/C][C]184.037312720943[/C][/ROW]
[ROW][C]81[/C][C]115.141496724557[/C][C]55.6951805796439[/C][C]174.58781286947[/C][/ROW]
[ROW][C]82[/C][C]109.65292775435[/C][C]49.8772680527437[/C][C]169.428587455956[/C][/ROW]
[ROW][C]83[/C][C]111.001051472729[/C][C]47.5832379374112[/C][C]174.418865008048[/C][/ROW]
[ROW][C]84[/C][C]127.394767928798[/C][C]52.7488380697567[/C][C]202.040697787838[/C][/ROW]
[/TABLE]
Source: https://freestatistics.org/blog/index.php?pk=203335&T=3

Globally Unique Identifier (entire table): ba.freestatistics.org/blog/index.php?pk=203335&T=3

As an alternative you can also use a QR Code:  

The GUIDs for individual cells are displayed in the table below:

Extrapolation Forecasts of Exponential Smoothing
tForecast95% Lower Bound95% Upper Bound
73112.05161965474191.3722683951888132.730970914293
74115.91259706883886.3140696596721145.511124478004
75113.63828652806278.2412547484588149.035318307665
76110.91642736141770.9437103483872150.889144374446
77106.25985023251963.0677131409036149.451987324134
78118.68048934795466.623331666994170.737647028913
79127.92383217856868.6277529069972187.219911450139
80123.62751659935163.2177204777596184.037312720943
81115.14149672455755.6951805796439174.58781286947
82109.6529277543549.8772680527437169.428587455956
83111.00105147272947.5832379374112174.418865008048
84127.39476792879852.7488380697567202.040697787838


Parameters (Session):
par1 = 12 ; par2 = Triple ; par3 = multiplicative ;
Parameters (R input):
par1 = 12 ; par2 = Triple ; par3 = multiplicative ;
R code (references can be found in the software module):
par1 <- as.numeric(par1)
if (par2 == 'Single') K <- 1
if (par2 == 'Double') K <- 2
if (par2 == 'Triple') K <- par1
nx <- length(x)
nxmK <- nx - K
x <- ts(x, frequency = par1)
if (par2 == 'Single') fit <- HoltWinters(x, gamma=F, beta=F)
if (par2 == 'Double') fit <- HoltWinters(x, gamma=F)
if (par2 == 'Triple') fit <- HoltWinters(x, seasonal=par3)
fit
myresid <- x - fit$fitted[,'xhat']
bitmap(file='test1.png')
op <- par(mfrow=c(2,1))
plot(fit,ylab='Observed (black) / Fitted (red)',main='Interpolation Fit of Exponential Smoothing')
plot(myresid,ylab='Residuals',main='Interpolation Prediction Errors')
par(op)
dev.off()
bitmap(file='test2.png')
p <- predict(fit, par1, prediction.interval=TRUE)
np <- length(p[,1])
plot(fit,p,ylab='Observed (black) / Fitted (red)',main='Extrapolation Fit of Exponential Smoothing')
dev.off()
bitmap(file='test3.png')
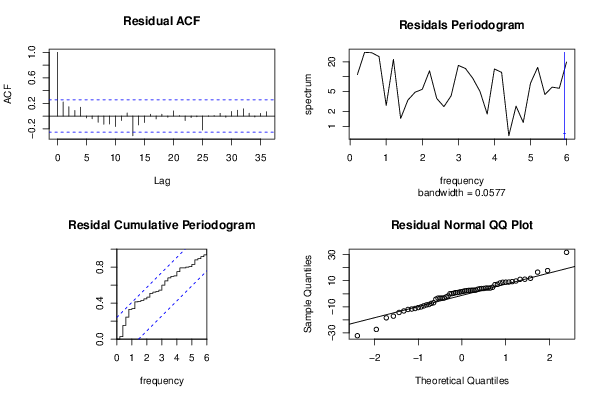
op <- par(mfrow = c(2,2))
acf(as.numeric(myresid),lag.max = nx/2,main='Residual ACF')
spectrum(myresid,main='Residals Periodogram')
cpgram(myresid,main='Residal Cumulative Periodogram')
qqnorm(myresid,main='Residual Normal QQ Plot')
qqline(myresid)
par(op)
dev.off()
load(file='createtable')
a<-table.start()
a<-table.row.start(a)
a<-table.element(a,'Estimated Parameters of Exponential Smoothing',2,TRUE)
a<-table.row.end(a)
a<-table.row.start(a)
a<-table.element(a,'Parameter',header=TRUE)
a<-table.element(a,'Value',header=TRUE)
a<-table.row.end(a)
a<-table.row.start(a)
a<-table.element(a,'alpha',header=TRUE)
a<-table.element(a,fit$alpha)
a<-table.row.end(a)
a<-table.row.start(a)
a<-table.element(a,'beta',header=TRUE)
a<-table.element(a,fit$beta)
a<-table.row.end(a)
a<-table.row.start(a)
a<-table.element(a,'gamma',header=TRUE)
a<-table.element(a,fit$gamma)
a<-table.row.end(a)
a<-table.end(a)
table.save(a,file='mytable.tab')
a<-table.start()
a<-table.row.start(a)
a<-table.element(a,'Interpolation Forecasts of Exponential Smoothing',4,TRUE)
a<-table.row.end(a)
a<-table.row.start(a)
a<-table.element(a,'t',header=TRUE)
a<-table.element(a,'Observed',header=TRUE)
a<-table.element(a,'Fitted',header=TRUE)
a<-table.element(a,'Residuals',header=TRUE)
a<-table.row.end(a)
for (i in 1:nxmK) {
a<-table.row.start(a)
a<-table.element(a,i+K,header=TRUE)
a<-table.element(a,x[i+K])
a<-table.element(a,fit$fitted[i,'xhat'])
a<-table.element(a,myresid[i])
a<-table.row.end(a)
}
a<-table.end(a)
table.save(a,file='mytable1.tab')
a<-table.start()
a<-table.row.start(a)
a<-table.element(a,'Extrapolation Forecasts of Exponential Smoothing',4,TRUE)
a<-table.row.end(a)
a<-table.row.start(a)
a<-table.element(a,'t',header=TRUE)
a<-table.element(a,'Forecast',header=TRUE)
a<-table.element(a,'95% Lower Bound',header=TRUE)
a<-table.element(a,'95% Upper Bound',header=TRUE)
a<-table.row.end(a)
for (i in 1:np) {
a<-table.row.start(a)
a<-table.element(a,nx+i,header=TRUE)
a<-table.element(a,p[i,'fit'])
a<-table.element(a,p[i,'lwr'])
a<-table.element(a,p[i,'upr'])
a<-table.row.end(a)
}
a<-table.end(a)
table.save(a,file='mytable2.tab')