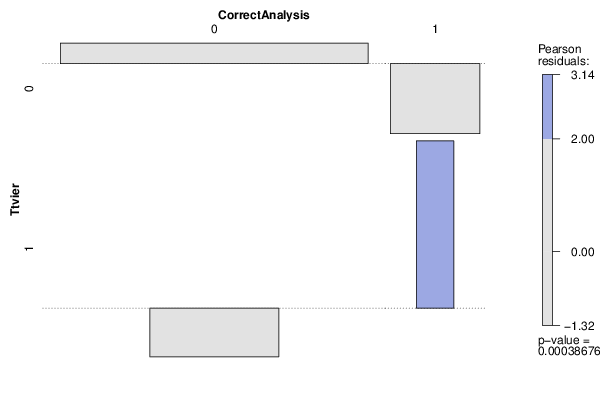
| Tabulation of Results | ||
| Ttvier x CorrectAnalysis | ||
| 0 | 1 | 0 | 125 | 6 | 1 | 17 | 6 |
| Tabulation of Expected Results | ||
| Ttvier x CorrectAnalysis | ||
| 0 | 1 | 0 | 120.79 | 10.21 | 1 | 21.21 | 1.79 |
| Statistical Results | |
| Pearson's Chi-squared test with simulated p-value (based on 2000 replicates) | |
| Exact Pearson Chi Square Statistic | 12.6 |
| P value | 0.01 |