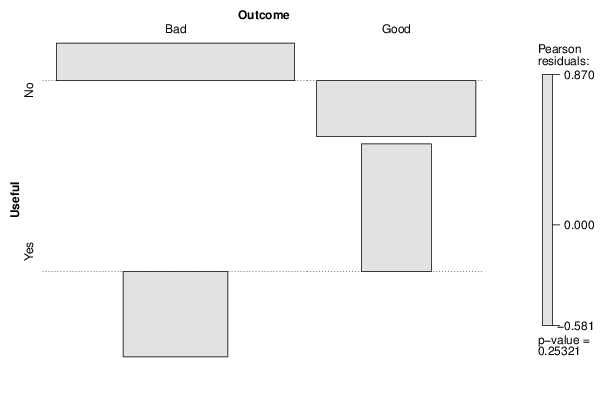
| Tabulation of Results | ||
| Useful x Outcome | ||
| Bad | Good | No | 41 | 16 | Yes | 6 | 5 |
| Tabulation of Expected Results | ||
| Useful x Outcome | ||
| Bad | Good | No | 39.4 | 17.6 | Yes | 7.6 | 3.4 |
| Statistical Results | |
| Pearson's Chi-squared test with simulated p-value (based on 2000 replicates) | |
| Exact Pearson Chi Square Statistic | 1.31 |
| P value | 0.29 |