| Tabulation of Results | ||
| CorrectAnalysis x Outcome | ||
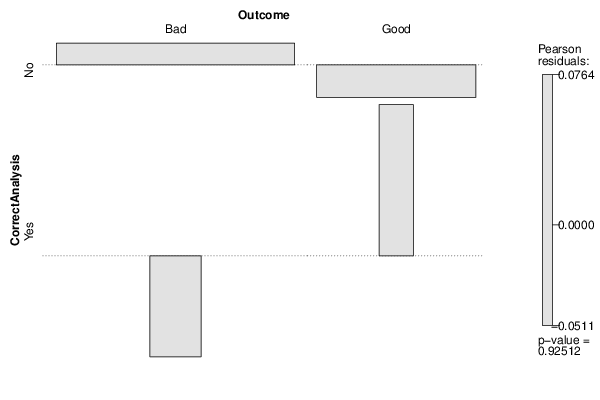
| Bad | Good | No | 45 | 20 | Yes | 2 | 1 |
| Tabulation of Expected Results | ||
| CorrectAnalysis x Outcome | ||
| Bad | Good | No | 44.93 | 20.07 | Yes | 2.07 | 0.93 |
| Statistical Results | |
| Pearson's Chi-squared test with Yates' continuity correction | |
| Pearson Chi Square Statistic | 0 |
| Degrees of Freedom | 1 |
| P value | 1 |