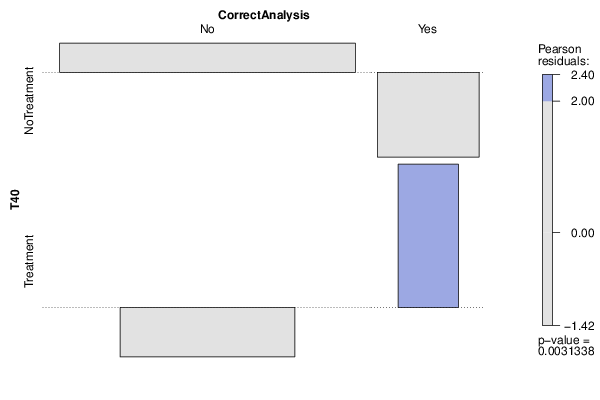
| Tabulation of Results | ||
| T40 x CorrectAnalysis | ||
| No | Yes | NoTreatment | 60 | 3 | Treatment | 16 | 6 |
| Tabulation of Expected Results | ||
| T40 x CorrectAnalysis | ||
| No | Yes | NoTreatment | 56.33 | 6.67 | Treatment | 19.67 | 2.33 |
| Statistical Results | |
| Pearson's Chi-squared test with Yates' continuity correction | |
| Pearson Chi Square Statistic | 6.51 |
| Degrees of Freedom | 1 |
| P value | 0.01 |