| Tabulation of Results | ||
| Connected x Belonging | ||
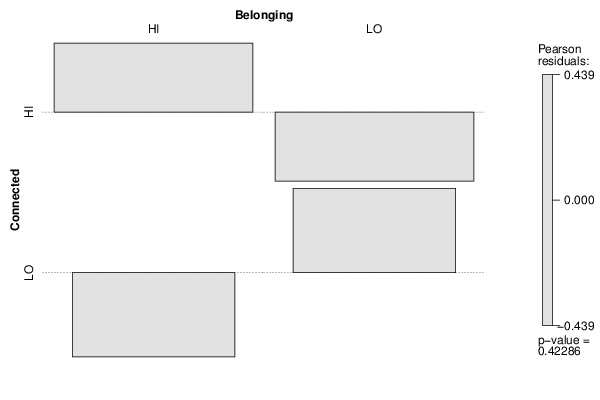
| HI | LO | HI | 51 | 46 | LO | 30 | 35 |
| Tabulation of Expected Results | ||
| Connected x Belonging | ||
| HI | LO | HI | 48.5 | 48.5 | LO | 32.5 | 32.5 |
| Statistical Results | |
| Pearson's Chi-squared test with Yates' continuity correction | |
| Pearson Chi Square Statistic | 0.41 |
| Degrees of Freedom | 1 |
| P value | 0.52 |