| Multiple Linear Regression - Estimated Regression Equation |
| Exchange_rate[t] = + 1.42759060003935 + 0.0314143615974818Dummies[t] -0.0287697257743677M1[t] -0.0484481990075852M2[t] -0.0232694914420618M3[t] -0.00714078387653842M4[t] -0.00738822884560742M5[t] -0.0163119148796643M6[t] -0.0122213278466348M7[t] -0.017309286947778M8[t] -0.0155139127155879M9[t] + 0.00321684022996043M10[t] + 0.00253842011498021M11[t] -0.00147870756552342t + e[t] |
| Multiple Linear Regression - Ordinary Least Squares | |||||
| Variable | Parameter | S.D. | T-STAT H0: parameter = 0 | 2-tail p-value | 1-tail p-value |
| (Intercept) | 1.42759060003935 | 0.043813 | 32.5834 | 0 | 0 |
| Dummies | 0.0314143615974818 | 0.023409 | 1.342 | 0.185126 | 0.092563 |
| M1 | -0.0287697257743677 | 0.052272 | -0.5504 | 0.58428 | 0.29214 |
| M2 | -0.0484481990075852 | 0.053269 | -0.9095 | 0.367052 | 0.183526 |
| M3 | -0.0232694914420618 | 0.053273 | -0.4368 | 0.66397 | 0.331985 |
| M4 | -0.00714078387653842 | 0.053283 | -0.134 | 0.893879 | 0.44694 |
| M5 | -0.00738822884560742 | 0.052198 | -0.1415 | 0.88796 | 0.44398 |
| M6 | -0.0163119148796643 | 0.052281 | -0.312 | 0.756219 | 0.378109 |
| M7 | -0.0122213278466348 | 0.053345 | -0.2291 | 0.819643 | 0.409821 |
| M8 | -0.017309286947778 | 0.053377 | -0.3243 | 0.746953 | 0.373477 |
| M9 | -0.0155139127155879 | 0.053414 | -0.2904 | 0.772566 | 0.386283 |
| M10 | 0.00321684022996043 | 0.055279 | 0.0582 | 0.953806 | 0.476903 |
| M11 | 0.00253842011498021 | 0.054702 | 0.0464 | 0.963156 | 0.481578 |
| t | -0.00147870756552342 | 0.000537 | -2.7544 | 0.007955 | 0.003978 |
| Multiple Linear Regression - Regression Statistics | |
| Multiple R | 0.436814740469516 |
| R-squared | 0.190807117491451 |
| Adjusted R-squared | -0.000456654737842621 |
| F-TEST (value) | 0.997612434741195 |
| F-TEST (DF numerator) | 13 |
| F-TEST (DF denominator) | 55 |
| p-value | 0.466179335276689 |
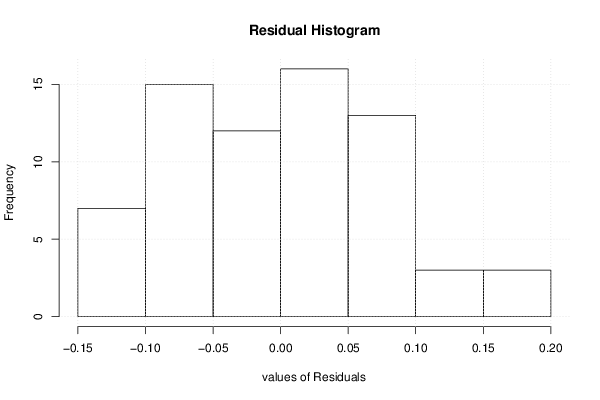
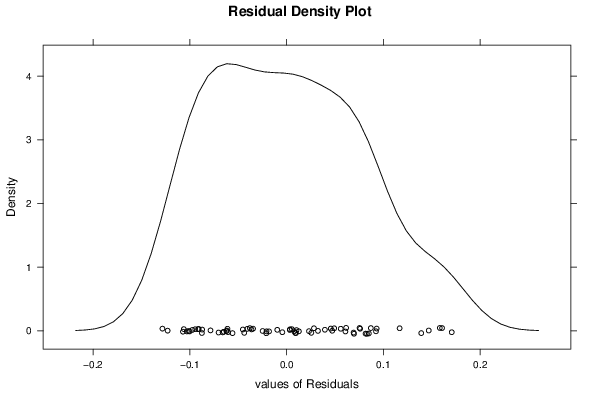
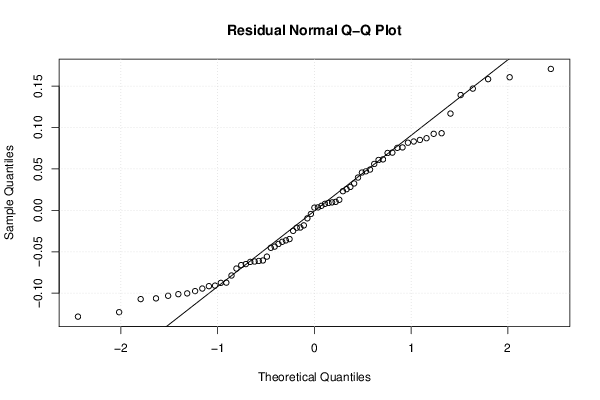
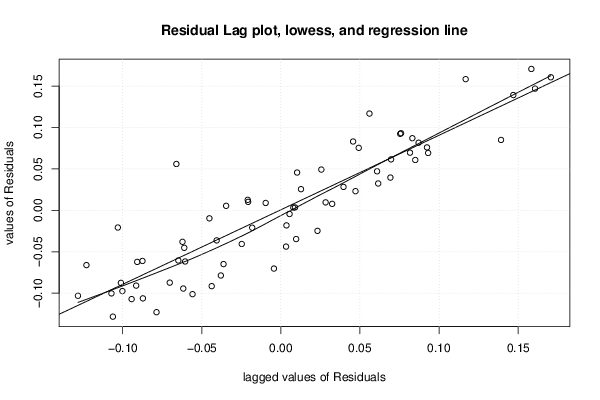
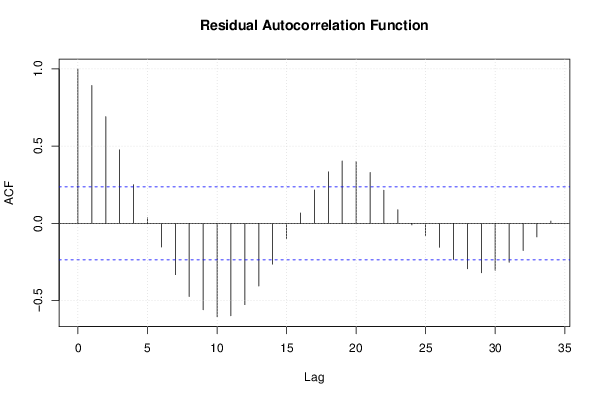
| Multiple Linear Regression - Residual Statistics | |
| Residual Standard Deviation | 0.0861859072925227 |
| Sum Squared Residuals | 0.408540583870942 |
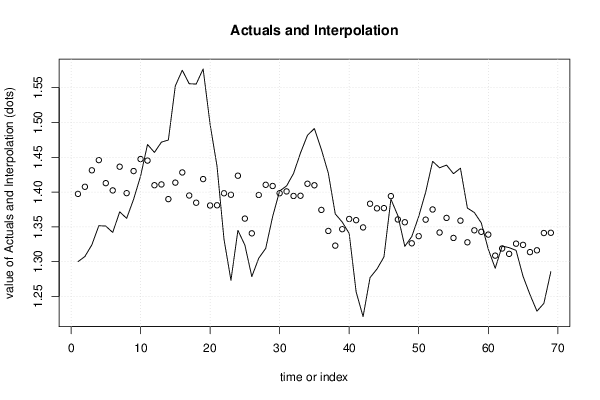
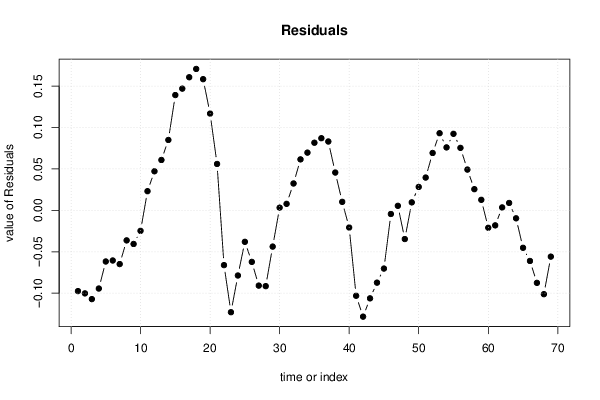
| Multiple Linear Regression - Actuals, Interpolation, and Residuals | |||
| Time or Index | Actuals | Interpolation Forecast | Residuals Prediction Error |
| 1 | 1.2999 | 1.39734216669946 | -0.0974421666994555 |
| 2 | 1.3074 | 1.4075993474982 | -0.100199347498197 |
| 3 | 1.3242 | 1.4312993474982 | -0.107099347498197 |
| 4 | 1.3516 | 1.4459493474982 | -0.0943493474981966 |
| 5 | 1.3511 | 1.41280883336612 | -0.0617088333661224 |
| 6 | 1.3419 | 1.40240643976654 | -0.060506439766542 |
| 7 | 1.3716 | 1.43643268083153 | -0.0648326808315299 |
| 8 | 1.3622 | 1.39845165256738 | -0.0362516525673814 |
| 9 | 1.3896 | 1.43018268083153 | -0.04058268083153 |
| 10 | 1.4227 | 1.44743472621155 | -0.0247347262115548 |
| 11 | 1.4684 | 1.44527759853105 | 0.0231224014689487 |
| 12 | 1.457 | 1.40984610925307 | 0.0471538907469342 |
| 13 | 1.4718 | 1.41101203751066 | 0.0607879624893435 |
| 14 | 1.4748 | 1.38985485671192 | 0.0849451432880846 |
| 15 | 1.5527 | 1.41355485671192 | 0.139145143288084 |
| 16 | 1.5751 | 1.42820485671192 | 0.146895143288084 |
| 17 | 1.5557 | 1.39506434257984 | 0.160635657420159 |
| 18 | 1.5553 | 1.38466194898026 | 0.170638051019739 |
| 19 | 1.577 | 1.41868819004525 | 0.158311809954751 |
| 20 | 1.4975 | 1.3807071617811 | 0.1167928382189 |
| 21 | 1.437 | 1.38102382844777 | 0.055976171552233 |
| 22 | 1.3322 | 1.39827587382779 | -0.066075873827792 |
| 23 | 1.2732 | 1.39611874614729 | -0.122918746147288 |
| 24 | 1.3449 | 1.42351598006427 | -0.0786159800642666 |
| 25 | 1.3239 | 1.36185318512689 | -0.0379531851268936 |
| 26 | 1.2785 | 1.34069600432815 | -0.0621960043281527 |
| 27 | 1.305 | 1.39581036592563 | -0.0908103659256345 |
| 28 | 1.319 | 1.41046036592563 | -0.0914603659256345 |
| 29 | 1.365 | 1.40873421339104 | -0.043734213391042 |
| 30 | 1.4016 | 1.39833181979146 | 0.00326818020853824 |
| 31 | 1.4088 | 1.40094369925897 | 0.00785630074103233 |
| 32 | 1.4268 | 1.3943770325923 | 0.0324229674076989 |
| 33 | 1.4562 | 1.39469369925897 | 0.0615063007410321 |
| 34 | 1.4816 | 1.41194574463899 | 0.0696542553610073 |
| 35 | 1.4914 | 1.40978861695849 | 0.081611383041511 |
| 36 | 1.4614 | 1.3743571276805 | 0.0870428723194964 |
| 37 | 1.4272 | 1.34410869434061 | 0.0830913056593874 |
| 38 | 1.3686 | 1.32295151354187 | 0.0456484864581284 |
| 39 | 1.3569 | 1.34665151354187 | 0.0102484864581284 |
| 40 | 1.3406 | 1.36130151354187 | -0.0207015135418716 |
| 41 | 1.2565 | 1.35957536100728 | -0.103075361007279 |
| 42 | 1.2209 | 1.3491729674077 | -0.128272967407699 |
| 43 | 1.277 | 1.38319920847269 | -0.106199208472687 |
| 44 | 1.2894 | 1.37663254180602 | -0.08723254180602 |
| 45 | 1.3067 | 1.37694920847269 | -0.0702492084726868 |
| 46 | 1.3898 | 1.39420125385271 | -0.00440125385271173 |
| 47 | 1.3661 | 1.36062976457473 | 0.00547023542527383 |
| 48 | 1.322 | 1.35661263689422 | -0.0346126368942226 |
| 49 | 1.336 | 1.32636420355433 | 0.00963579644566855 |
| 50 | 1.3649 | 1.33662138435307 | 0.0282786156469277 |
| 51 | 1.3999 | 1.36032138435307 | 0.0395786156469276 |
| 52 | 1.4442 | 1.37497138435307 | 0.0692286156469276 |
| 53 | 1.4349 | 1.341830870221 | 0.093069129779002 |
| 54 | 1.4388 | 1.3628428382189 | 0.0759571617811005 |
| 55 | 1.4264 | 1.33404035608892 | 0.0923596439110761 |
| 56 | 1.4343 | 1.35888805101974 | 0.0754119489802609 |
| 57 | 1.377 | 1.32779035608892 | 0.0492096439110761 |
| 58 | 1.3706 | 1.34504240146895 | 0.0255575985310512 |
| 59 | 1.3556 | 1.34288527378845 | 0.0127147262115547 |
| 60 | 1.3179 | 1.33886814610794 | -0.0209681461079415 |
| 61 | 1.2905 | 1.30861971276805 | -0.0181197127680505 |
| 62 | 1.3224 | 1.31887689356679 | 0.00352310643320877 |
| 63 | 1.3201 | 1.31116253196931 | 0.0089374680306906 |
| 64 | 1.3162 | 1.32581253196931 | -0.0096125319693094 |
| 65 | 1.2789 | 1.32408637943472 | -0.0451863794347171 |
| 66 | 1.2526 | 1.31368398583514 | -0.0610839858351368 |
| 67 | 1.2288 | 1.31629586530264 | -0.0874958653026429 |
| 68 | 1.24 | 1.34114356023346 | -0.101143560233458 |
| 69 | 1.2856 | 1.34146022690012 | -0.0558602269001245 |
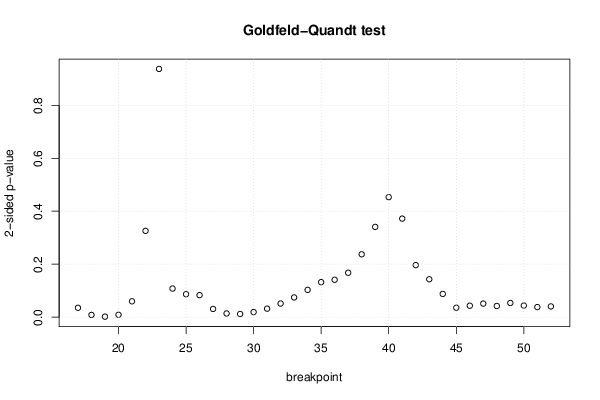
| Goldfeld-Quandt test for Heteroskedasticity | |||
| p-values | Alternative Hypothesis | ||
| breakpoint index | greater | 2-sided | less |
| 17 | 0.0177212273212443 | 0.0354424546424886 | 0.982278772678756 |
| 18 | 0.00423982939953102 | 0.00847965879906204 | 0.995760170600469 |
| 19 | 0.00101557657291583 | 0.00203115314583166 | 0.998984423427084 |
| 20 | 0.00454364394788262 | 0.00908728789576523 | 0.995456356052117 |
| 21 | 0.030039662142255 | 0.06007932428451 | 0.969960337857745 |
| 22 | 0.162997183126356 | 0.325994366252713 | 0.837002816873644 |
| 23 | 0.46858080155151 | 0.93716160310302 | 0.53141919844849 |
| 24 | 0.945900865282278 | 0.108198269435444 | 0.0540991347177219 |
| 25 | 0.956582054815657 | 0.0868358903686861 | 0.0434179451843431 |
| 26 | 0.958404018957292 | 0.0831919620854164 | 0.0415959810427082 |
| 27 | 0.984438719876258 | 0.0311225602474841 | 0.0155612801237421 |
| 28 | 0.992978302423507 | 0.014043395152986 | 0.00702169757649299 |
| 29 | 0.99397989006495 | 0.0120402198700992 | 0.00602010993504962 |
| 30 | 0.990401311846645 | 0.0191973763067089 | 0.00959868815335446 |
| 31 | 0.983880363814867 | 0.0322392723702663 | 0.0161196361851332 |
| 32 | 0.974219866430899 | 0.0515602671382018 | 0.0257801335691009 |
| 33 | 0.962721333093678 | 0.0745573338126447 | 0.0372786669063224 |
| 34 | 0.948441548122911 | 0.103116903754178 | 0.0515584518770891 |
| 35 | 0.933843481844256 | 0.132313036311488 | 0.0661565181557438 |
| 36 | 0.929379269659269 | 0.141241460681461 | 0.0706207303407305 |
| 37 | 0.916115498796483 | 0.167769002407033 | 0.0838845012035166 |
| 38 | 0.881251949240577 | 0.237496101518845 | 0.118748050759423 |
| 39 | 0.829546382080207 | 0.340907235839586 | 0.170453617919793 |
| 40 | 0.773438928647173 | 0.453122142705653 | 0.226561071352827 |
| 41 | 0.813931368262505 | 0.37213726347499 | 0.186068631737495 |
| 42 | 0.901703494605777 | 0.196593010788447 | 0.0982965053942233 |
| 43 | 0.928372061164412 | 0.143255877671176 | 0.0716279388355882 |
| 44 | 0.956087039187663 | 0.0878259216246736 | 0.0439129608123368 |
| 45 | 0.982135714143797 | 0.0357285717124051 | 0.0178642858562026 |
| 46 | 0.978396278028358 | 0.0432074439432838 | 0.0216037219716419 |
| 47 | 0.974332841336259 | 0.0513343173274814 | 0.0256671586637407 |
| 48 | 0.978871271114838 | 0.0422574577703242 | 0.0211287288851621 |
| 49 | 0.97316283927413 | 0.0536743214517406 | 0.0268371607258703 |
| 50 | 0.978065154234229 | 0.0438696915315418 | 0.0219348457657709 |
| 51 | 0.980934515490489 | 0.038130969019022 | 0.019065484509511 |
| 52 | 0.97967638547319 | 0.0406472290536203 | 0.0203236145268101 |
| Meta Analysis of Goldfeld-Quandt test for Heteroskedasticity | |||
| Description | # significant tests | % significant tests | OK/NOK |
| 1% type I error level | 3 | 0.0833333333333333 | NOK |
| 5% type I error level | 15 | 0.416666666666667 | NOK |
| 10% type I error level | 23 | 0.638888888888889 | NOK |