| Tabulation of Results | ||
| T40 x T20 | ||
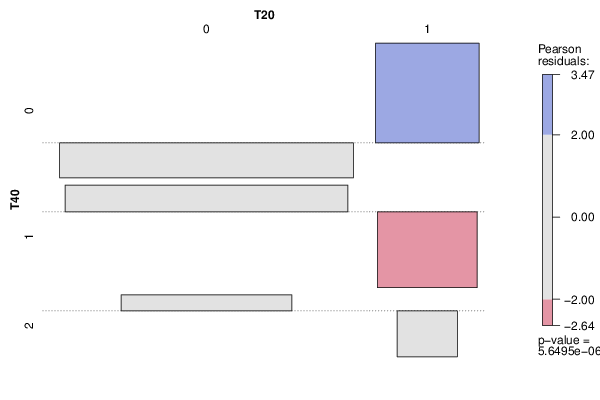
| 0 | 1 | 0 | 51 | 17 | 1 | 63 | 0 | 2 | 23 | 0 |
| Tabulation of Expected Results | ||
| T40 x T20 | ||
| 0 | 1 | 0 | 60.49 | 7.51 | 1 | 56.05 | 6.95 | 2 | 20.46 | 2.54 |
| Statistical Results | |
| Pearson's Chi-squared test | |
| Pearson Chi Square Statistic | 24.17 |
| Degrees of Freedom | 2 |
| P value | 0 |