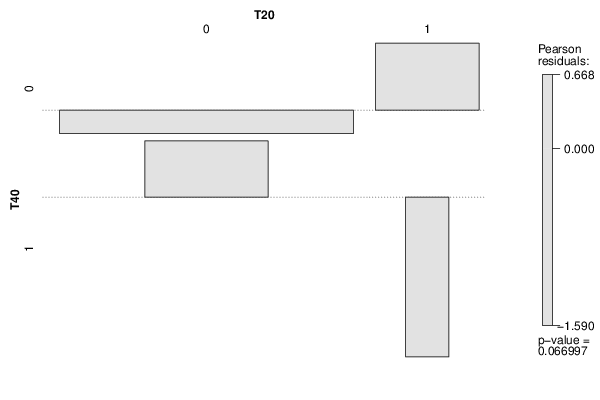
| Tabulation of Results | ||
| T40 x T20 | ||
| 0 | 1 | 0 | 114 | 17 | 1 | 23 | 0 |
| Tabulation of Expected Results | ||
| T40 x T20 | ||
| 0 | 1 | 0 | 116.54 | 14.46 | 1 | 20.46 | 2.54 |
| Statistical Results | |
| Pearson's Chi-squared test with Yates' continuity correction | |
| Pearson Chi Square Statistic | 2.16 |
| Degrees of Freedom | 1 |
| P value | 0.14 |