| Tabulation of Results | ||
| T x Used | ||
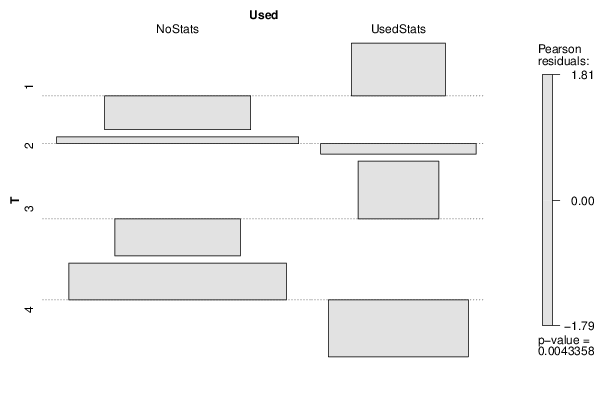
| NoStats | UsedStats | 1 | 12 | 11 | 2 | 46 | 17 | 3 | 8 | 9 | 4 | 43 | 8 |
| Tabulation of Expected Results | ||
| T x Used | ||
| NoStats | UsedStats | 1 | 16.28 | 6.72 | 2 | 44.59 | 18.41 | 3 | 12.03 | 4.97 | 4 | 36.1 | 14.9 |
| Statistical Results | |
| Pearson's Chi-squared test | |
| Pearson Chi Square Statistic | 13.14 |
| Degrees of Freedom | 3 |
| P value | 0 |