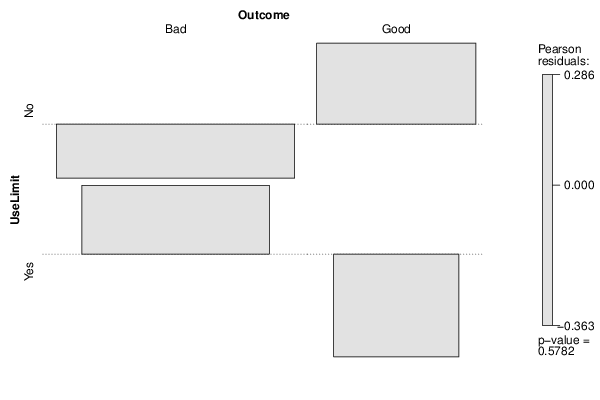
| Tabulation of Results | ||
| UseLimit x Outcome | ||
| Bad | Good | No | 28 | 14 | Yes | 19 | 7 |
| Tabulation of Expected Results | ||
| UseLimit x Outcome | ||
| Bad | Good | No | 29.03 | 12.97 | Yes | 17.97 | 8.03 |
| Statistical Results | |
| Pearson's Chi-squared test with Yates' continuity correction | |
| Pearson Chi Square Statistic | 0.08 |
| Degrees of Freedom | 1 |
| P value | 0.77 |