Free Statistics

of Irreproducible Research!

Author's title

Author*The author of this computation has been verified*
R Software Modulerwasp_Simple Regression Y ~ X.wasp
Title produced by softwareSimple Linear Regression
Date of computationThu, 20 Dec 2012 14:38:22 -0500
Cite this page as followsStatistical Computations at FreeStatistics.org, Office for Research Development and Education, URL https://freestatistics.org/blog/index.php?v=date/2012/Dec/20/t1356032320yipvrsweejacazp.htm/, Retrieved Thu, 25 Apr 2024 09:07:02 +0000
Statistical Computations at FreeStatistics.org, Office for Research Development and Education, URL https://freestatistics.org/blog/index.php?pk=203058, Retrieved Thu, 25 Apr 2024 09:07:02 +0000
QR Codes:

Original text written by user:
IsPrivate?No (this computation is public)
User-defined keywords
Estimated Impact147
Family? (F = Feedback message, R = changed R code, M = changed R Module, P = changed Parameters, D = changed Data)
-     [Multiple Regression] [WS7] [2012-11-03 15:32:37] [0287c3a79787f56bc35e5faae1b93dfd]
- RMPD    [Simple Linear Regression] [simple regression] [2012-12-20 19:38:22] [4c7c16453d038d093cc11140275f1ca7] [Current]
Feedback Forum

Post a new message
Dataseries X:
10951	3113
10840	3085
10753	3064
10667	3040
10585	3017
10511	2997
10446	2980
10396	2967
10355	2957
10310	2945
10263	2935
10239	2930
10214	2924
10192	2917
10170	2911
10143	2902
10131	2897
10101	2888
10068	2877
10022	2862
9987	2849
9948	2835
9928	2826
9876	2813
9865	2808
9859	2803
9858	2801
9853	2798
9858	2795
9855	2789
9863	2788
9855	2781
9842	2774
9837	2767
9823	2759
9813	2752
9788	2741
9757	2728
9727	2717
9695	2705
9651	2687
9660	2683
9632	2668
9606	2657
9556	2638
9499	2617
9428	2595
9328	2564
9251	2537
9190	2514


Summary of computational transaction
Raw Inputview raw input (R code)
Raw Outputview raw output of R engine
Computing time3 seconds
R Server'Gwilym Jenkins' @ jenkins.wessa.net

\begin{tabular}{lllllllll}
\hline
Summary of computational transaction \tabularnewline
Raw Input & view raw input (R code)  \tabularnewline
Raw Output & view raw output of R engine  \tabularnewline
Computing time & 3 seconds \tabularnewline
R Server & 'Gwilym Jenkins' @ jenkins.wessa.net \tabularnewline
\hline
\end{tabular}
%Source: https://freestatistics.org/blog/index.php?pk=203058&T=0

[TABLE]
[ROW][C]Summary of computational transaction[/C][/ROW]
[ROW][C]Raw Input[/C][C]view raw input (R code) [/C][/ROW]
[ROW][C]Raw Output[/C][C]view raw output of R engine [/C][/ROW]
[ROW][C]Computing time[/C][C]3 seconds[/C][/ROW]
[ROW][C]R Server[/C][C]'Gwilym Jenkins' @ jenkins.wessa.net[/C][/ROW]
[/TABLE]
Source: https://freestatistics.org/blog/index.php?pk=203058&T=0

Globally Unique Identifier (entire table): ba.freestatistics.org/blog/index.php?pk=203058&T=0

As an alternative you can also use a QR Code:  

The GUIDs for individual cells are displayed in the table below:

Summary of computational transaction
Raw Inputview raw input (R code)
Raw Outputview raw output of R engine
Computing time3 seconds
R Server'Gwilym Jenkins' @ jenkins.wessa.net


Linear Regression Model
Y ~ X
coefficients:
EstimateStd. Errort valuePr(>|t|)
(Intercept)2298.486179.94512.7730
X2.7240.06442.7470
- - -
Residual Std. Err. 63.75 on 48 df
Multiple R-sq. 0.974
Adjusted R-sq. 0.974

\begin{tabular}{lllllllll}
\hline
Linear Regression Model \tabularnewline
Y ~ X \tabularnewline
coefficients: &   \tabularnewline
  & Estimate & Std. Error & t value & Pr(>|t|) \tabularnewline
(Intercept) & 2298.486 & 179.945 & 12.773 & 0 \tabularnewline
X & 2.724 & 0.064 & 42.747 & 0 \tabularnewline
- - -  &   \tabularnewline
Residual Std. Err.  & 63.75  on  48 df \tabularnewline
Multiple R-sq.  & 0.974 \tabularnewline
Adjusted R-sq.  & 0.974 \tabularnewline
\hline
\end{tabular}
%Source: https://freestatistics.org/blog/index.php?pk=203058&T=1

[TABLE]
[ROW][C]Linear Regression Model[/C][/ROW]
[ROW][C]Y ~ X[/C][/ROW]
[ROW][C]coefficients:[/C][C] [/C][/ROW]
[ROW][C] [/C][C]Estimate[/C][C]Std. Error[/C][C]t value[/C][C]Pr(>|t|)[/C][/ROW]
[C](Intercept)[/C][C]2298.486[/C][C]179.945[/C][C]12.773[/C][C]0[/C][/ROW]
[C]X[/C][C]2.724[/C][C]0.064[/C][C]42.747[/C][C]0[/C][/ROW]
[ROW][C]- - - [/C][C] [/C][/ROW]
[ROW][C]Residual Std. Err. [/C][C]63.75  on  48 df[/C][/ROW]
[ROW][C]Multiple R-sq. [/C][C]0.974[/C][/ROW]
[ROW][C]Adjusted R-sq. [/C][C]0.974[/C][/ROW]
[/TABLE]
Source: https://freestatistics.org/blog/index.php?pk=203058&T=1

Globally Unique Identifier (entire table): ba.freestatistics.org/blog/index.php?pk=203058&T=1

As an alternative you can also use a QR Code:  

The GUIDs for individual cells are displayed in the table below:

Linear Regression Model
Y ~ X
coefficients:
EstimateStd. Errort valuePr(>|t|)
(Intercept)2298.486179.94512.7730
X2.7240.06442.7470
- - -
Residual Std. Err. 63.75 on 48 df
Multiple R-sq. 0.974
Adjusted R-sq. 0.974


ANOVA Statistics
DfSum SqMean SqF valuePr(>F)
Mannen_Vlaanderen17426294.2227426294.2221827.2960
Residuals48195076.2784064.089

\begin{tabular}{lllllllll}
\hline
ANOVA Statistics \tabularnewline
  & Df & Sum Sq & Mean Sq & F value & Pr(>F) \tabularnewline
Mannen_Vlaanderen & 1 & 7426294.222 & 7426294.222 & 1827.296 & 0 \tabularnewline
Residuals & 48 & 195076.278 & 4064.089 &   &   \tabularnewline
\hline
\end{tabular}
%Source: https://freestatistics.org/blog/index.php?pk=203058&T=2

[TABLE]
[ROW][C]ANOVA Statistics[/C][/ROW]
[ROW][C] [/C][C]Df[/C][C]Sum Sq[/C][C]Mean Sq[/C][C]F value[/C][C]Pr(>F)[/C][/ROW]
[ROW][C]Mannen_Vlaanderen[/C][C]1[/C][C]7426294.222[/C][C]7426294.222[/C][C]1827.296[/C][C]0[/C][/ROW]
[ROW][C]Residuals[/C][C]48[/C][C]195076.278[/C][C]4064.089[/C][C] [/C][C] [/C][/ROW]
[/TABLE]
Source: https://freestatistics.org/blog/index.php?pk=203058&T=2

Globally Unique Identifier (entire table): ba.freestatistics.org/blog/index.php?pk=203058&T=2

As an alternative you can also use a QR Code:  

The GUIDs for individual cells are displayed in the table below:

ANOVA Statistics
DfSum SqMean SqF valuePr(>F)
Mannen_Vlaanderen17426294.2227426294.2221827.2960
Residuals48195076.2784064.089


Parameters (Session):
par1 = 1 ; par2 = 2 ; par3 = TRUE ;
Parameters (R input):
par1 = 1 ; par2 = 2 ; par3 = TRUE ;
R code (references can be found in the software module):
cat1 <- as.numeric(par1)
cat2<- as.numeric(par2)
intercept<-as.logical(par3)
x <- t(x)
xdf<-data.frame(t(y))
(V1<-dimnames(y)[[1]][cat1])
(V2<-dimnames(y)[[1]][cat2])
xdf <- data.frame(xdf[[cat1]], xdf[[cat2]])
names(xdf)<-c('Y', 'X')
if(intercept == FALSE) (lmxdf<-lm(Y~ X - 1, data = xdf) ) else (lmxdf<-lm(Y~ X, data = xdf) )
sumlmxdf<-summary(lmxdf)
(aov.xdf<-aov(lmxdf) )
(anova.xdf<-anova(lmxdf) )
load(file='createtable')
a<-table.start()
nc <- ncol(sumlmxdf$'coefficients')
nr <- nrow(sumlmxdf$'coefficients')
a<-table.row.start(a)
a<-table.element(a,'Linear Regression Model', nc+1,TRUE)
a<-table.row.end(a)
a<-table.row.start(a)
a<-table.element(a, lmxdf$call['formula'],nc+1)
a<-table.row.end(a)
a<-table.row.start(a)
a<-table.element(a, 'coefficients:',1,TRUE)
a<-table.element(a, ' ',nc,TRUE)
a<-table.row.end(a)
a<-table.row.start(a)
a<-table.element(a, ' ',1,TRUE)
for(i in 1 : nc){
a<-table.element(a, dimnames(sumlmxdf$'coefficients')[[2]][i],1,TRUE)
}#end header
a<-table.row.end(a)
for(i in 1: nr){
a<-table.element(a,dimnames(sumlmxdf$'coefficients')[[1]][i] ,1,TRUE)
for(j in 1 : nc){
a<-table.element(a, round(sumlmxdf$coefficients[i, j], digits=3), 1 ,FALSE)
}
a<-table.row.end(a)
}
a<-table.row.start(a)
a<-table.element(a, '- - - ',1,TRUE)
a<-table.element(a, ' ',nc,FALSE)
a<-table.row.end(a)
a<-table.row.start(a)
a<-table.element(a, 'Residual Std. Err. ',1,TRUE)
a<-table.element(a, paste(round(sumlmxdf$'sigma', digits=3), ' on ', sumlmxdf$'df'[2], 'df') ,nc, FALSE)
a<-table.row.end(a)
a<-table.row.start(a)
a<-table.element(a, 'Multiple R-sq. ',1,TRUE)
a<-table.element(a, round(sumlmxdf$'r.squared', digits=3) ,nc, FALSE)
a<-table.row.end(a)
a<-table.row.start(a)
a<-table.element(a, 'Adjusted R-sq. ',1,TRUE)
a<-table.element(a, round(sumlmxdf$'adj.r.squared', digits=3) ,nc, FALSE)
a<-table.row.end(a)
a<-table.end(a)
table.save(a,file='mytable.tab')
a<-table.start()
a<-table.row.start(a)
a<-table.element(a,'ANOVA Statistics', 5+1,TRUE)
a<-table.row.end(a)
a<-table.row.start(a)
a<-table.element(a, ' ',1,TRUE)
a<-table.element(a, 'Df',1,TRUE)
a<-table.element(a, 'Sum Sq',1,TRUE)
a<-table.element(a, 'Mean Sq',1,TRUE)
a<-table.element(a, 'F value',1,TRUE)
a<-table.element(a, 'Pr(>F)',1,TRUE)
a<-table.row.end(a)
a<-table.row.start(a)
a<-table.element(a, V2,1,TRUE)
a<-table.element(a, anova.xdf$Df[1])
a<-table.element(a, round(anova.xdf$'Sum Sq'[1], digits=3))
a<-table.element(a, round(anova.xdf$'Mean Sq'[1], digits=3))
a<-table.element(a, round(anova.xdf$'F value'[1], digits=3))
a<-table.element(a, round(anova.xdf$'Pr(>F)'[1], digits=3))
a<-table.row.end(a)
a<-table.row.start(a)
a<-table.element(a, 'Residuals',1,TRUE)
a<-table.element(a, anova.xdf$Df[2])
a<-table.element(a, round(anova.xdf$'Sum Sq'[2], digits=3))
a<-table.element(a, round(anova.xdf$'Mean Sq'[2], digits=3))
a<-table.element(a, ' ')
a<-table.row.end(a)
a<-table.end(a)
table.save(a,file='mytable1.tab')
bitmap(file='regressionplot.png')
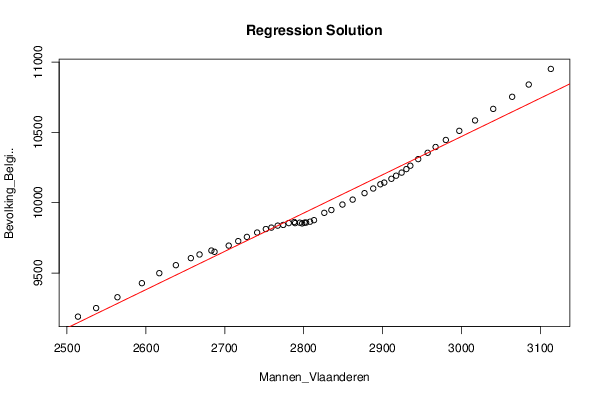
plot(Y~ X, data=xdf, xlab=V2, ylab=V1, main='Regression Solution')
if(intercept == TRUE) abline(coef(lmxdf), col='red')
if(intercept == FALSE) abline(0.0, coef(lmxdf), col='red')
dev.off()
library(car)
bitmap(file='residualsQQplot.png')
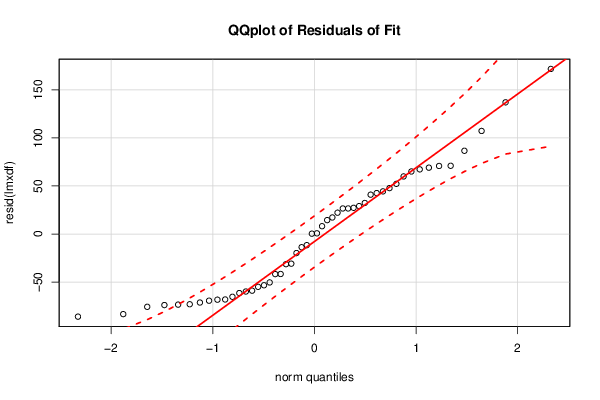
qq.plot(resid(lmxdf), main='QQplot of Residuals of Fit')
dev.off()
bitmap(file='residualsplot.png')
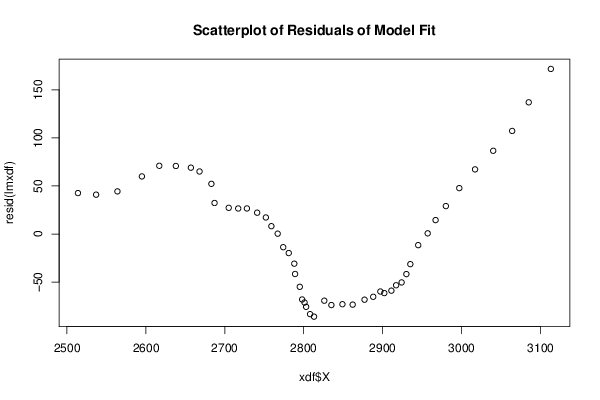
plot(xdf$X, resid(lmxdf), main='Scatterplot of Residuals of Model Fit')
dev.off()
bitmap(file='cooksDistanceLmplot.png')
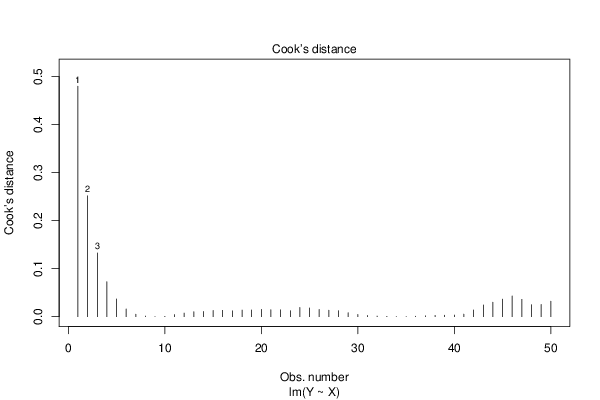
plot.lm(lmxdf, which=4)
dev.off()