Free Statistics

of Irreproducible Research!

Author's title

Author*The author of this computation has been verified*
R Software Modulerwasp_Simple Regression Y ~ X.wasp
Title produced by softwareSimple Linear Regression
Date of computationThu, 20 Dec 2012 14:27:50 -0500
Cite this page as followsStatistical Computations at FreeStatistics.org, Office for Research Development and Education, URL https://freestatistics.org/blog/index.php?v=date/2012/Dec/20/t1356031698y19r11a8ezx4c78.htm/, Retrieved Tue, 16 Apr 2024 20:24:52 +0000
Statistical Computations at FreeStatistics.org, Office for Research Development and Education, URL https://freestatistics.org/blog/index.php?pk=203043, Retrieved Tue, 16 Apr 2024 20:24:52 +0000
QR Codes:

Original text written by user:
IsPrivate?No (this computation is public)
User-defined keywords
Estimated Impact61
Family? (F = Feedback message, R = changed R code, M = changed R Module, P = changed Parameters, D = changed Data)
-       [Simple Linear Regression] [] [2012-12-20 19:27:50] [acfd67cb214b61d0a5e0fb4c8c6ef02a] [Current]
Feedback Forum

Post a new message
Dataseries X:
0.439620618	65.2261159
0.415578668	66.18192324
0.374927888	68.51084108
0.347499866	70.33722683
0.327363973	71.143908
0.30912795	71.73414119
0.294782014	71.99927612
0.271568014	73.59456359
0.24362019	76.89891122
0.219233356	78.58059708
0.198928656	81.23539893
0.153201781	90.76678766
0.136500202	92.88460144
0.1247118	93.66937745
0.125838095	88.60410226
0.136887675	79.25341207
0.124547993	77.2465582
0.107159561	81.65647728
0.104998434	79.13140312
0.107308572	75.54106548
0.104528533	73.37597484
0.08088668	76.58704251
0.059476192	86.94640339
0.053914856	92.58089844
0.051123828	92.06547505
0.046363275	94.67242843
0.044694892	94.25869487
0.040634361	99.41227085
0.038625779	98.61304918
0.040071656	96.84902718
0.039128976	95.23722912
0.03841219	96.77880196
0.037037037	96.9227634
0.034563019	99.45702834
0.033502125	99.64352421
0.034427132	98.73290651
0.032522094	99.24435175
0.028919522	106.3037831
0.028209468	106.1372524
0.030091905	104.0509283
0.031718983	101.0545734
0.032220944	100
0.030558106	100.8805611
0.028205662	101.6755514
0.023910542	106.8457317


Summary of computational transaction
Raw Inputview raw input (R code)
Raw Outputview raw output of R engine
Computing time3 seconds
R Server'Gwilym Jenkins' @ jenkins.wessa.net

\begin{tabular}{lllllllll}
\hline
Summary of computational transaction \tabularnewline
Raw Input & view raw input (R code)  \tabularnewline
Raw Output & view raw output of R engine  \tabularnewline
Computing time & 3 seconds \tabularnewline
R Server & 'Gwilym Jenkins' @ jenkins.wessa.net \tabularnewline
\hline
\end{tabular}
%Source: https://freestatistics.org/blog/index.php?pk=203043&T=0

[TABLE]
[ROW][C]Summary of computational transaction[/C][/ROW]
[ROW][C]Raw Input[/C][C]view raw input (R code) [/C][/ROW]
[ROW][C]Raw Output[/C][C]view raw output of R engine [/C][/ROW]
[ROW][C]Computing time[/C][C]3 seconds[/C][/ROW]
[ROW][C]R Server[/C][C]'Gwilym Jenkins' @ jenkins.wessa.net[/C][/ROW]
[/TABLE]
Source: https://freestatistics.org/blog/index.php?pk=203043&T=0

Globally Unique Identifier (entire table): ba.freestatistics.org/blog/index.php?pk=203043&T=0

As an alternative you can also use a QR Code:  

The GUIDs for individual cells are displayed in the table below:

Summary of computational transaction
Raw Inputview raw input (R code)
Raw Outputview raw output of R engine
Computing time3 seconds
R Server'Gwilym Jenkins' @ jenkins.wessa.net


Linear Regression Model
Y ~ X
coefficients:
EstimateStd. Errort valuePr(>|t|)
(Intercept)0.8530.06513.0590
X-0.0080.001-11.2610
- - -
Residual Std. Err. 0.061 on 43 df
Multiple R-sq. 0.747
Adjusted R-sq. 0.741

\begin{tabular}{lllllllll}
\hline
Linear Regression Model \tabularnewline
Y ~ X \tabularnewline
coefficients: &   \tabularnewline
  & Estimate & Std. Error & t value & Pr(>|t|) \tabularnewline
(Intercept) & 0.853 & 0.065 & 13.059 & 0 \tabularnewline
X & -0.008 & 0.001 & -11.261 & 0 \tabularnewline
- - -  &   \tabularnewline
Residual Std. Err.  & 0.061  on  43 df \tabularnewline
Multiple R-sq.  & 0.747 \tabularnewline
Adjusted R-sq.  & 0.741 \tabularnewline
\hline
\end{tabular}
%Source: https://freestatistics.org/blog/index.php?pk=203043&T=1

[TABLE]
[ROW][C]Linear Regression Model[/C][/ROW]
[ROW][C]Y ~ X[/C][/ROW]
[ROW][C]coefficients:[/C][C] [/C][/ROW]
[ROW][C] [/C][C]Estimate[/C][C]Std. Error[/C][C]t value[/C][C]Pr(>|t|)[/C][/ROW]
[C](Intercept)[/C][C]0.853[/C][C]0.065[/C][C]13.059[/C][C]0[/C][/ROW]
[C]X[/C][C]-0.008[/C][C]0.001[/C][C]-11.261[/C][C]0[/C][/ROW]
[ROW][C]- - - [/C][C] [/C][/ROW]
[ROW][C]Residual Std. Err. [/C][C]0.061  on  43 df[/C][/ROW]
[ROW][C]Multiple R-sq. [/C][C]0.747[/C][/ROW]
[ROW][C]Adjusted R-sq. [/C][C]0.741[/C][/ROW]
[/TABLE]
Source: https://freestatistics.org/blog/index.php?pk=203043&T=1

Globally Unique Identifier (entire table): ba.freestatistics.org/blog/index.php?pk=203043&T=1

As an alternative you can also use a QR Code:  

The GUIDs for individual cells are displayed in the table below:

Linear Regression Model
Y ~ X
coefficients:
EstimateStd. Errort valuePr(>|t|)
(Intercept)0.8530.06513.0590
X-0.0080.001-11.2610
- - -
Residual Std. Err. 0.061 on 43 df
Multiple R-sq. 0.747
Adjusted R-sq. 0.741


ANOVA Statistics
DfSum SqMean SqF valuePr(>F)
Pov10.4720.472126.820
Residuals430.160.004

\begin{tabular}{lllllllll}
\hline
ANOVA Statistics \tabularnewline
  & Df & Sum Sq & Mean Sq & F value & Pr(>F) \tabularnewline
Pov & 1 & 0.472 & 0.472 & 126.82 & 0 \tabularnewline
Residuals & 43 & 0.16 & 0.004 &   &   \tabularnewline
\hline
\end{tabular}
%Source: https://freestatistics.org/blog/index.php?pk=203043&T=2

[TABLE]
[ROW][C]ANOVA Statistics[/C][/ROW]
[ROW][C] [/C][C]Df[/C][C]Sum Sq[/C][C]Mean Sq[/C][C]F value[/C][C]Pr(>F)[/C][/ROW]
[ROW][C]Pov[/C][C]1[/C][C]0.472[/C][C]0.472[/C][C]126.82[/C][C]0[/C][/ROW]
[ROW][C]Residuals[/C][C]43[/C][C]0.16[/C][C]0.004[/C][C] [/C][C] [/C][/ROW]
[/TABLE]
Source: https://freestatistics.org/blog/index.php?pk=203043&T=2

Globally Unique Identifier (entire table): ba.freestatistics.org/blog/index.php?pk=203043&T=2

As an alternative you can also use a QR Code:  

The GUIDs for individual cells are displayed in the table below:

ANOVA Statistics
DfSum SqMean SqF valuePr(>F)
Pov10.4720.472126.820
Residuals430.160.004


Parameters (Session):
par1 = 1 ; par2 = 2 ; par3 = TRUE ;
Parameters (R input):
par1 = 1 ; par2 = 2 ; par3 = TRUE ;
R code (references can be found in the software module):
cat1 <- as.numeric(par1)
cat2<- as.numeric(par2)
intercept<-as.logical(par3)
x <- t(x)
xdf<-data.frame(t(y))
(V1<-dimnames(y)[[1]][cat1])
(V2<-dimnames(y)[[1]][cat2])
xdf <- data.frame(xdf[[cat1]], xdf[[cat2]])
names(xdf)<-c('Y', 'X')
if(intercept == FALSE) (lmxdf<-lm(Y~ X - 1, data = xdf) ) else (lmxdf<-lm(Y~ X, data = xdf) )
sumlmxdf<-summary(lmxdf)
(aov.xdf<-aov(lmxdf) )
(anova.xdf<-anova(lmxdf) )
load(file='createtable')
a<-table.start()
nc <- ncol(sumlmxdf$'coefficients')
nr <- nrow(sumlmxdf$'coefficients')
a<-table.row.start(a)
a<-table.element(a,'Linear Regression Model', nc+1,TRUE)
a<-table.row.end(a)
a<-table.row.start(a)
a<-table.element(a, lmxdf$call['formula'],nc+1)
a<-table.row.end(a)
a<-table.row.start(a)
a<-table.element(a, 'coefficients:',1,TRUE)
a<-table.element(a, ' ',nc,TRUE)
a<-table.row.end(a)
a<-table.row.start(a)
a<-table.element(a, ' ',1,TRUE)
for(i in 1 : nc){
a<-table.element(a, dimnames(sumlmxdf$'coefficients')[[2]][i],1,TRUE)
}#end header
a<-table.row.end(a)
for(i in 1: nr){
a<-table.element(a,dimnames(sumlmxdf$'coefficients')[[1]][i] ,1,TRUE)
for(j in 1 : nc){
a<-table.element(a, round(sumlmxdf$coefficients[i, j], digits=3), 1 ,FALSE)
}
a<-table.row.end(a)
}
a<-table.row.start(a)
a<-table.element(a, '- - - ',1,TRUE)
a<-table.element(a, ' ',nc,FALSE)
a<-table.row.end(a)
a<-table.row.start(a)
a<-table.element(a, 'Residual Std. Err. ',1,TRUE)
a<-table.element(a, paste(round(sumlmxdf$'sigma', digits=3), ' on ', sumlmxdf$'df'[2], 'df') ,nc, FALSE)
a<-table.row.end(a)
a<-table.row.start(a)
a<-table.element(a, 'Multiple R-sq. ',1,TRUE)
a<-table.element(a, round(sumlmxdf$'r.squared', digits=3) ,nc, FALSE)
a<-table.row.end(a)
a<-table.row.start(a)
a<-table.element(a, 'Adjusted R-sq. ',1,TRUE)
a<-table.element(a, round(sumlmxdf$'adj.r.squared', digits=3) ,nc, FALSE)
a<-table.row.end(a)
a<-table.end(a)
table.save(a,file='mytable.tab')
a<-table.start()
a<-table.row.start(a)
a<-table.element(a,'ANOVA Statistics', 5+1,TRUE)
a<-table.row.end(a)
a<-table.row.start(a)
a<-table.element(a, ' ',1,TRUE)
a<-table.element(a, 'Df',1,TRUE)
a<-table.element(a, 'Sum Sq',1,TRUE)
a<-table.element(a, 'Mean Sq',1,TRUE)
a<-table.element(a, 'F value',1,TRUE)
a<-table.element(a, 'Pr(>F)',1,TRUE)
a<-table.row.end(a)
a<-table.row.start(a)
a<-table.element(a, V2,1,TRUE)
a<-table.element(a, anova.xdf$Df[1])
a<-table.element(a, round(anova.xdf$'Sum Sq'[1], digits=3))
a<-table.element(a, round(anova.xdf$'Mean Sq'[1], digits=3))
a<-table.element(a, round(anova.xdf$'F value'[1], digits=3))
a<-table.element(a, round(anova.xdf$'Pr(>F)'[1], digits=3))
a<-table.row.end(a)
a<-table.row.start(a)
a<-table.element(a, 'Residuals',1,TRUE)
a<-table.element(a, anova.xdf$Df[2])
a<-table.element(a, round(anova.xdf$'Sum Sq'[2], digits=3))
a<-table.element(a, round(anova.xdf$'Mean Sq'[2], digits=3))
a<-table.element(a, ' ')
a<-table.row.end(a)
a<-table.end(a)
table.save(a,file='mytable1.tab')
bitmap(file='regressionplot.png')
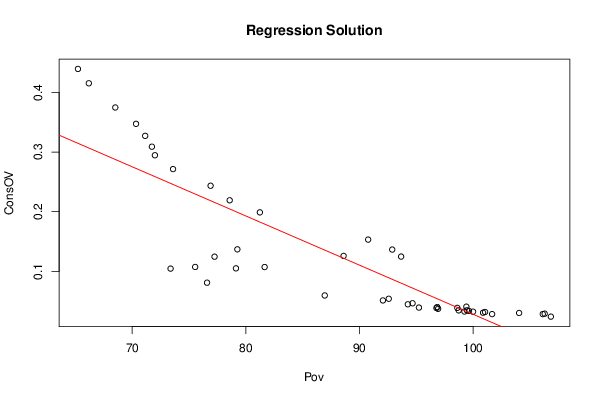
plot(Y~ X, data=xdf, xlab=V2, ylab=V1, main='Regression Solution')
if(intercept == TRUE) abline(coef(lmxdf), col='red')
if(intercept == FALSE) abline(0.0, coef(lmxdf), col='red')
dev.off()
library(car)
bitmap(file='residualsQQplot.png')
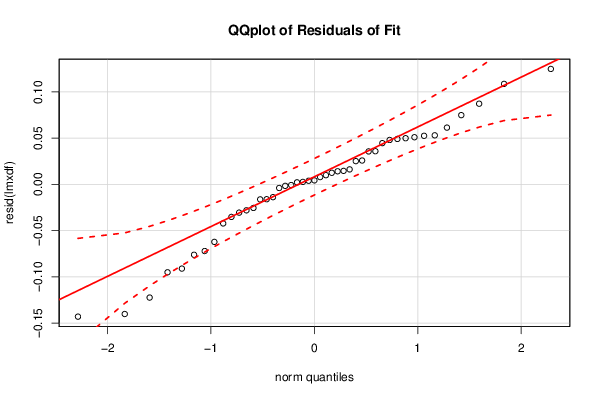
qq.plot(resid(lmxdf), main='QQplot of Residuals of Fit')
dev.off()
bitmap(file='residualsplot.png')
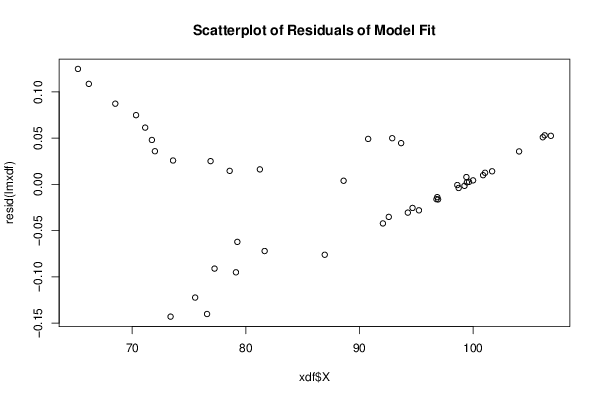
plot(xdf$X, resid(lmxdf), main='Scatterplot of Residuals of Model Fit')
dev.off()
bitmap(file='cooksDistanceLmplot.png')
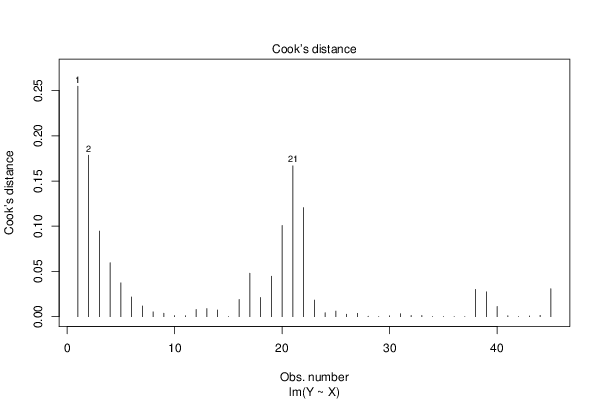
plot.lm(lmxdf, which=4)
dev.off()