Free Statistics

of Irreproducible Research!

Author's title

Author*Unverified author*
R Software Module--
Title produced by software(Partial) Autocorrelation Function
Date of computationThu, 20 Dec 2012 14:20:26 -0500
Cite this page as followsStatistical Computations at FreeStatistics.org, Office for Research Development and Education, URL https://freestatistics.org/blog/index.php?v=date/2012/Dec/20/t1356031239uzhkjpaguk41az0.htm/, Retrieved Thu, 25 Apr 2024 20:53:44 +0000
Statistical Computations at FreeStatistics.org, Office for Research Development and Education, URL https://freestatistics.org/blog/index.php?pk=203030, Retrieved Thu, 25 Apr 2024 20:53:44 +0000
QR Codes:

Original text written by user:
IsPrivate?No (this computation is public)
User-defined keywords
Estimated Impact130
Family? (F = Feedback message, R = changed R code, M = changed R Module, P = changed Parameters, D = changed Data)
F     [Univariate Data Series] [HPC Retail Sales] [2008-03-02 15:42:48] [74be16979710d4c4e7c6647856088456]
- RMPD  [(Partial) Autocorrelation Function] [Autocorrelatiefun...] [2012-11-10 16:56:48] [391561951b5d7f721cfaa4f5575ab127]
- R P     [(Partial) Autocorrelation Function] [] [2012-11-24 00:03:24] [74be16979710d4c4e7c6647856088456]
-   P       [(Partial) Autocorrelation Function] [Langetermijntrend...] [2012-11-24 09:07:33] [74be16979710d4c4e7c6647856088456]
-  M            [(Partial) Autocorrelation Function] [] [2012-12-20 19:20:26] [d41d8cd98f00b204e9800998ecf8427e] [Current]
Feedback Forum

Post a new message
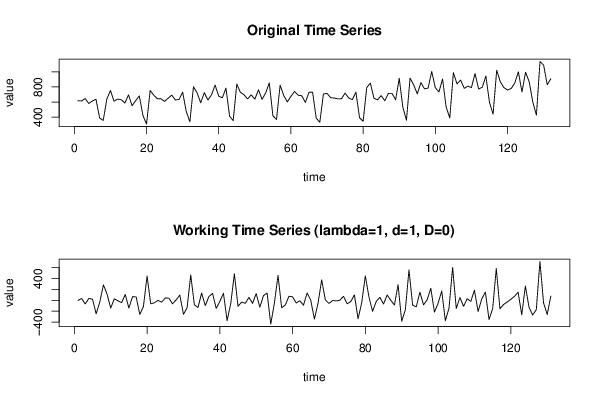
Dataseries X:
617
614
647
580
614
636
388
356
639
753
611
639
630
586
695
552
619
681
421
307
754
690
644
643
608
651
691
627
634
731
475
337
803
722
590
724
627
696
825
677
656
785
412
352
839
729
696
641
695
638
762
635
721
854
418
367
824
687
601
676
740
691
683
594
729
731
386
331
706
715
657
653
642
643
718
654
632
731
392
344
792
852
649
629
685
617
715
715
629
916
531
357
917
828
708
858
775
785
1006
789
734
906
532
387
991
841
892
782
811
792
978
773
796
946
594
438
1023
868
791
760
779
852
1001
734
996
869
599
426
1138
1091
830
909


Summary of computational transaction
Raw Inputview raw input (R code)
Raw Outputview raw output of R engine
Computing time2 seconds
R Server'Gertrude Mary Cox' @ cox.wessa.net

\begin{tabular}{lllllllll}
\hline
Summary of computational transaction \tabularnewline
Raw Input & view raw input (R code)  \tabularnewline
Raw Output & view raw output of R engine  \tabularnewline
Computing time & 2 seconds \tabularnewline
R Server & 'Gertrude Mary Cox' @ cox.wessa.net \tabularnewline
\hline
\end{tabular}
%Source: https://freestatistics.org/blog/index.php?pk=203030&T=0

[TABLE]
[ROW][C]Summary of computational transaction[/C][/ROW]
[ROW][C]Raw Input[/C][C]view raw input (R code) [/C][/ROW]
[ROW][C]Raw Output[/C][C]view raw output of R engine [/C][/ROW]
[ROW][C]Computing time[/C][C]2 seconds[/C][/ROW]
[ROW][C]R Server[/C][C]'Gertrude Mary Cox' @ cox.wessa.net[/C][/ROW]
[/TABLE]
Source: https://freestatistics.org/blog/index.php?pk=203030&T=0

Globally Unique Identifier (entire table): ba.freestatistics.org/blog/index.php?pk=203030&T=0

As an alternative you can also use a QR Code:  

The GUIDs for individual cells are displayed in the table below:

Summary of computational transaction
Raw Inputview raw input (R code)
Raw Outputview raw output of R engine
Computing time2 seconds
R Server'Gertrude Mary Cox' @ cox.wessa.net


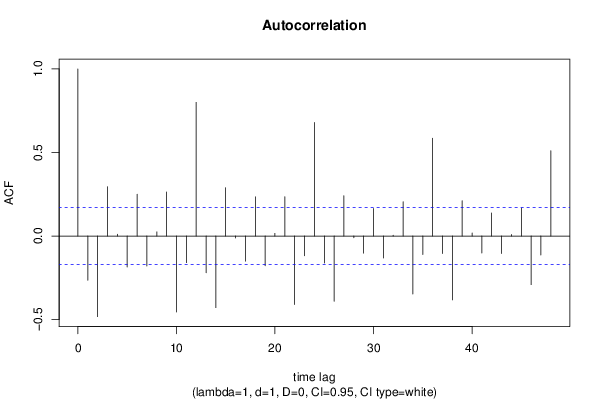
Autocorrelation Function
Time lag kACF(k)T-STATP-value
1-0.265081-3.0340.001456
2-0.482754-5.52540
30.2948473.37470.000486
40.0103610.11860.452891
5-0.185136-2.1190.01799
60.2501952.86360.00244
7-0.179587-2.05550.02091
80.0246780.28250.389022
90.2631893.01230.001556
10-0.455428-5.21260
11-0.159313-1.82340.03526
120.8000199.15660
13-0.21968-2.51430.006568
14-0.428793-4.90781e-06
150.288423.30110.000621
16-0.012113-0.13860.444975
17-0.150449-1.7220.043718
180.2344942.68390.004108
19-0.178184-2.03940.02171
200.015690.17960.42888
210.2345762.68480.004097
22-0.40997-4.69233e-06
23-0.118195-1.35280.089224
240.6796867.77940
25-0.161689-1.85060.033239
26-0.390245-4.46668e-06
270.2414362.76340.003273
28-0.010771-0.12330.451037
29-0.10245-1.17260.121543
300.1642331.87970.031183
31-0.131998-1.51080.066626
320.0048750.05580.477794
330.2053552.35040.010123
34-0.34706-3.97235.8e-05
35-0.111216-1.27290.10265
360.5851916.69780
37-0.105042-1.20230.115716
38-0.382489-4.37781.2e-05
390.2106792.41130.008641
400.0183110.20960.417159
41-0.101838-1.16560.12295
420.1376681.57570.058756
43-0.104546-1.19660.116814
440.0088690.10150.459651
450.1671131.91270.028984
46-0.291157-3.33240.00056
47-0.114066-1.30550.096999
480.5102865.84050

\begin{tabular}{lllllllll}
\hline
Autocorrelation Function \tabularnewline
Time lag k & ACF(k) & T-STAT & P-value \tabularnewline
1 & -0.265081 & -3.034 & 0.001456 \tabularnewline
2 & -0.482754 & -5.5254 & 0 \tabularnewline
3 & 0.294847 & 3.3747 & 0.000486 \tabularnewline
4 & 0.010361 & 0.1186 & 0.452891 \tabularnewline
5 & -0.185136 & -2.119 & 0.01799 \tabularnewline
6 & 0.250195 & 2.8636 & 0.00244 \tabularnewline
7 & -0.179587 & -2.0555 & 0.02091 \tabularnewline
8 & 0.024678 & 0.2825 & 0.389022 \tabularnewline
9 & 0.263189 & 3.0123 & 0.001556 \tabularnewline
10 & -0.455428 & -5.2126 & 0 \tabularnewline
11 & -0.159313 & -1.8234 & 0.03526 \tabularnewline
12 & 0.800019 & 9.1566 & 0 \tabularnewline
13 & -0.21968 & -2.5143 & 0.006568 \tabularnewline
14 & -0.428793 & -4.9078 & 1e-06 \tabularnewline
15 & 0.28842 & 3.3011 & 0.000621 \tabularnewline
16 & -0.012113 & -0.1386 & 0.444975 \tabularnewline
17 & -0.150449 & -1.722 & 0.043718 \tabularnewline
18 & 0.234494 & 2.6839 & 0.004108 \tabularnewline
19 & -0.178184 & -2.0394 & 0.02171 \tabularnewline
20 & 0.01569 & 0.1796 & 0.42888 \tabularnewline
21 & 0.234576 & 2.6848 & 0.004097 \tabularnewline
22 & -0.40997 & -4.6923 & 3e-06 \tabularnewline
23 & -0.118195 & -1.3528 & 0.089224 \tabularnewline
24 & 0.679686 & 7.7794 & 0 \tabularnewline
25 & -0.161689 & -1.8506 & 0.033239 \tabularnewline
26 & -0.390245 & -4.4666 & 8e-06 \tabularnewline
27 & 0.241436 & 2.7634 & 0.003273 \tabularnewline
28 & -0.010771 & -0.1233 & 0.451037 \tabularnewline
29 & -0.10245 & -1.1726 & 0.121543 \tabularnewline
30 & 0.164233 & 1.8797 & 0.031183 \tabularnewline
31 & -0.131998 & -1.5108 & 0.066626 \tabularnewline
32 & 0.004875 & 0.0558 & 0.477794 \tabularnewline
33 & 0.205355 & 2.3504 & 0.010123 \tabularnewline
34 & -0.34706 & -3.9723 & 5.8e-05 \tabularnewline
35 & -0.111216 & -1.2729 & 0.10265 \tabularnewline
36 & 0.585191 & 6.6978 & 0 \tabularnewline
37 & -0.105042 & -1.2023 & 0.115716 \tabularnewline
38 & -0.382489 & -4.3778 & 1.2e-05 \tabularnewline
39 & 0.210679 & 2.4113 & 0.008641 \tabularnewline
40 & 0.018311 & 0.2096 & 0.417159 \tabularnewline
41 & -0.101838 & -1.1656 & 0.12295 \tabularnewline
42 & 0.137668 & 1.5757 & 0.058756 \tabularnewline
43 & -0.104546 & -1.1966 & 0.116814 \tabularnewline
44 & 0.008869 & 0.1015 & 0.459651 \tabularnewline
45 & 0.167113 & 1.9127 & 0.028984 \tabularnewline
46 & -0.291157 & -3.3324 & 0.00056 \tabularnewline
47 & -0.114066 & -1.3055 & 0.096999 \tabularnewline
48 & 0.510286 & 5.8405 & 0 \tabularnewline
\hline
\end{tabular}
%Source: https://freestatistics.org/blog/index.php?pk=203030&T=1

[TABLE]
[ROW][C]Autocorrelation Function[/C][/ROW]
[ROW][C]Time lag k[/C][C]ACF(k)[/C][C]T-STAT[/C][C]P-value[/C][/ROW]
[ROW][C]1[/C][C]-0.265081[/C][C]-3.034[/C][C]0.001456[/C][/ROW]
[ROW][C]2[/C][C]-0.482754[/C][C]-5.5254[/C][C]0[/C][/ROW]
[ROW][C]3[/C][C]0.294847[/C][C]3.3747[/C][C]0.000486[/C][/ROW]
[ROW][C]4[/C][C]0.010361[/C][C]0.1186[/C][C]0.452891[/C][/ROW]
[ROW][C]5[/C][C]-0.185136[/C][C]-2.119[/C][C]0.01799[/C][/ROW]
[ROW][C]6[/C][C]0.250195[/C][C]2.8636[/C][C]0.00244[/C][/ROW]
[ROW][C]7[/C][C]-0.179587[/C][C]-2.0555[/C][C]0.02091[/C][/ROW]
[ROW][C]8[/C][C]0.024678[/C][C]0.2825[/C][C]0.389022[/C][/ROW]
[ROW][C]9[/C][C]0.263189[/C][C]3.0123[/C][C]0.001556[/C][/ROW]
[ROW][C]10[/C][C]-0.455428[/C][C]-5.2126[/C][C]0[/C][/ROW]
[ROW][C]11[/C][C]-0.159313[/C][C]-1.8234[/C][C]0.03526[/C][/ROW]
[ROW][C]12[/C][C]0.800019[/C][C]9.1566[/C][C]0[/C][/ROW]
[ROW][C]13[/C][C]-0.21968[/C][C]-2.5143[/C][C]0.006568[/C][/ROW]
[ROW][C]14[/C][C]-0.428793[/C][C]-4.9078[/C][C]1e-06[/C][/ROW]
[ROW][C]15[/C][C]0.28842[/C][C]3.3011[/C][C]0.000621[/C][/ROW]
[ROW][C]16[/C][C]-0.012113[/C][C]-0.1386[/C][C]0.444975[/C][/ROW]
[ROW][C]17[/C][C]-0.150449[/C][C]-1.722[/C][C]0.043718[/C][/ROW]
[ROW][C]18[/C][C]0.234494[/C][C]2.6839[/C][C]0.004108[/C][/ROW]
[ROW][C]19[/C][C]-0.178184[/C][C]-2.0394[/C][C]0.02171[/C][/ROW]
[ROW][C]20[/C][C]0.01569[/C][C]0.1796[/C][C]0.42888[/C][/ROW]
[ROW][C]21[/C][C]0.234576[/C][C]2.6848[/C][C]0.004097[/C][/ROW]
[ROW][C]22[/C][C]-0.40997[/C][C]-4.6923[/C][C]3e-06[/C][/ROW]
[ROW][C]23[/C][C]-0.118195[/C][C]-1.3528[/C][C]0.089224[/C][/ROW]
[ROW][C]24[/C][C]0.679686[/C][C]7.7794[/C][C]0[/C][/ROW]
[ROW][C]25[/C][C]-0.161689[/C][C]-1.8506[/C][C]0.033239[/C][/ROW]
[ROW][C]26[/C][C]-0.390245[/C][C]-4.4666[/C][C]8e-06[/C][/ROW]
[ROW][C]27[/C][C]0.241436[/C][C]2.7634[/C][C]0.003273[/C][/ROW]
[ROW][C]28[/C][C]-0.010771[/C][C]-0.1233[/C][C]0.451037[/C][/ROW]
[ROW][C]29[/C][C]-0.10245[/C][C]-1.1726[/C][C]0.121543[/C][/ROW]
[ROW][C]30[/C][C]0.164233[/C][C]1.8797[/C][C]0.031183[/C][/ROW]
[ROW][C]31[/C][C]-0.131998[/C][C]-1.5108[/C][C]0.066626[/C][/ROW]
[ROW][C]32[/C][C]0.004875[/C][C]0.0558[/C][C]0.477794[/C][/ROW]
[ROW][C]33[/C][C]0.205355[/C][C]2.3504[/C][C]0.010123[/C][/ROW]
[ROW][C]34[/C][C]-0.34706[/C][C]-3.9723[/C][C]5.8e-05[/C][/ROW]
[ROW][C]35[/C][C]-0.111216[/C][C]-1.2729[/C][C]0.10265[/C][/ROW]
[ROW][C]36[/C][C]0.585191[/C][C]6.6978[/C][C]0[/C][/ROW]
[ROW][C]37[/C][C]-0.105042[/C][C]-1.2023[/C][C]0.115716[/C][/ROW]
[ROW][C]38[/C][C]-0.382489[/C][C]-4.3778[/C][C]1.2e-05[/C][/ROW]
[ROW][C]39[/C][C]0.210679[/C][C]2.4113[/C][C]0.008641[/C][/ROW]
[ROW][C]40[/C][C]0.018311[/C][C]0.2096[/C][C]0.417159[/C][/ROW]
[ROW][C]41[/C][C]-0.101838[/C][C]-1.1656[/C][C]0.12295[/C][/ROW]
[ROW][C]42[/C][C]0.137668[/C][C]1.5757[/C][C]0.058756[/C][/ROW]
[ROW][C]43[/C][C]-0.104546[/C][C]-1.1966[/C][C]0.116814[/C][/ROW]
[ROW][C]44[/C][C]0.008869[/C][C]0.1015[/C][C]0.459651[/C][/ROW]
[ROW][C]45[/C][C]0.167113[/C][C]1.9127[/C][C]0.028984[/C][/ROW]
[ROW][C]46[/C][C]-0.291157[/C][C]-3.3324[/C][C]0.00056[/C][/ROW]
[ROW][C]47[/C][C]-0.114066[/C][C]-1.3055[/C][C]0.096999[/C][/ROW]
[ROW][C]48[/C][C]0.510286[/C][C]5.8405[/C][C]0[/C][/ROW]
[/TABLE]
Source: https://freestatistics.org/blog/index.php?pk=203030&T=1

Globally Unique Identifier (entire table): ba.freestatistics.org/blog/index.php?pk=203030&T=1

As an alternative you can also use a QR Code:  

The GUIDs for individual cells are displayed in the table below:

Autocorrelation Function
Time lag kACF(k)T-STATP-value
1-0.265081-3.0340.001456
2-0.482754-5.52540
30.2948473.37470.000486
40.0103610.11860.452891
5-0.185136-2.1190.01799
60.2501952.86360.00244
7-0.179587-2.05550.02091
80.0246780.28250.389022
90.2631893.01230.001556
10-0.455428-5.21260
11-0.159313-1.82340.03526
120.8000199.15660
13-0.21968-2.51430.006568
14-0.428793-4.90781e-06
150.288423.30110.000621
16-0.012113-0.13860.444975
17-0.150449-1.7220.043718
180.2344942.68390.004108
19-0.178184-2.03940.02171
200.015690.17960.42888
210.2345762.68480.004097
22-0.40997-4.69233e-06
23-0.118195-1.35280.089224
240.6796867.77940
25-0.161689-1.85060.033239
26-0.390245-4.46668e-06
270.2414362.76340.003273
28-0.010771-0.12330.451037
29-0.10245-1.17260.121543
300.1642331.87970.031183
31-0.131998-1.51080.066626
320.0048750.05580.477794
330.2053552.35040.010123
34-0.34706-3.97235.8e-05
35-0.111216-1.27290.10265
360.5851916.69780
37-0.105042-1.20230.115716
38-0.382489-4.37781.2e-05
390.2106792.41130.008641
400.0183110.20960.417159
41-0.101838-1.16560.12295
420.1376681.57570.058756
43-0.104546-1.19660.116814
440.0088690.10150.459651
450.1671131.91270.028984
46-0.291157-3.33240.00056
47-0.114066-1.30550.096999
480.5102865.84050


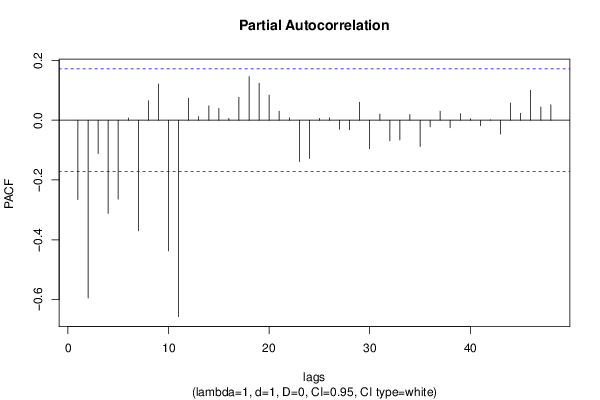
Partial Autocorrelation Function
Time lag kPACF(k)T-STATP-value
1-0.265081-3.0340.001456
2-0.594818-6.8080
3-0.11138-1.27480.102319
4-0.311569-3.56610.000253
5-0.263918-3.02070.001517
60.00730.08360.466769
7-0.369779-4.23232.2e-05
80.0649390.74330.229327
90.120911.38390.084375
10-0.436984-5.00151e-06
11-0.656913-7.51870
120.0732240.83810.201753
130.0118740.13590.446054
140.0477390.54640.29286
150.0388790.4450.328531
160.0055360.06340.474786
170.0767170.87810.190759
180.1458661.66950.048702
190.1233081.41130.08026
200.0836490.95740.170063
210.0299150.34240.366302
220.0079870.09140.46365
23-0.138352-1.58350.057859
24-0.128389-1.46950.072051
250.0059210.06780.473037
260.0077880.08910.464552
27-0.030364-0.34750.364373
28-0.031731-0.36320.358528
290.0596750.6830.247903
30-0.095102-1.08850.139189
310.0203260.23260.408201
32-0.069151-0.79150.215052
33-0.066557-0.76180.223779
340.0189340.21670.414388
35-0.087807-1.0050.158376
36-0.022357-0.25590.39922
370.0301630.34520.365238
38-0.025474-0.29160.385542
390.0215140.24620.402943
400.0047530.05440.478349
41-0.018852-0.21580.41475
420.0009210.01050.495802
43-0.046103-0.52770.299311
440.0570930.65350.257304
450.02280.2610.397268
460.099831.14260.127643
470.0438430.50180.308324
480.0512180.58620.27937

\begin{tabular}{lllllllll}
\hline
Partial Autocorrelation Function \tabularnewline
Time lag k & PACF(k) & T-STAT & P-value \tabularnewline
1 & -0.265081 & -3.034 & 0.001456 \tabularnewline
2 & -0.594818 & -6.808 & 0 \tabularnewline
3 & -0.11138 & -1.2748 & 0.102319 \tabularnewline
4 & -0.311569 & -3.5661 & 0.000253 \tabularnewline
5 & -0.263918 & -3.0207 & 0.001517 \tabularnewline
6 & 0.0073 & 0.0836 & 0.466769 \tabularnewline
7 & -0.369779 & -4.2323 & 2.2e-05 \tabularnewline
8 & 0.064939 & 0.7433 & 0.229327 \tabularnewline
9 & 0.12091 & 1.3839 & 0.084375 \tabularnewline
10 & -0.436984 & -5.0015 & 1e-06 \tabularnewline
11 & -0.656913 & -7.5187 & 0 \tabularnewline
12 & 0.073224 & 0.8381 & 0.201753 \tabularnewline
13 & 0.011874 & 0.1359 & 0.446054 \tabularnewline
14 & 0.047739 & 0.5464 & 0.29286 \tabularnewline
15 & 0.038879 & 0.445 & 0.328531 \tabularnewline
16 & 0.005536 & 0.0634 & 0.474786 \tabularnewline
17 & 0.076717 & 0.8781 & 0.190759 \tabularnewline
18 & 0.145866 & 1.6695 & 0.048702 \tabularnewline
19 & 0.123308 & 1.4113 & 0.08026 \tabularnewline
20 & 0.083649 & 0.9574 & 0.170063 \tabularnewline
21 & 0.029915 & 0.3424 & 0.366302 \tabularnewline
22 & 0.007987 & 0.0914 & 0.46365 \tabularnewline
23 & -0.138352 & -1.5835 & 0.057859 \tabularnewline
24 & -0.128389 & -1.4695 & 0.072051 \tabularnewline
25 & 0.005921 & 0.0678 & 0.473037 \tabularnewline
26 & 0.007788 & 0.0891 & 0.464552 \tabularnewline
27 & -0.030364 & -0.3475 & 0.364373 \tabularnewline
28 & -0.031731 & -0.3632 & 0.358528 \tabularnewline
29 & 0.059675 & 0.683 & 0.247903 \tabularnewline
30 & -0.095102 & -1.0885 & 0.139189 \tabularnewline
31 & 0.020326 & 0.2326 & 0.408201 \tabularnewline
32 & -0.069151 & -0.7915 & 0.215052 \tabularnewline
33 & -0.066557 & -0.7618 & 0.223779 \tabularnewline
34 & 0.018934 & 0.2167 & 0.414388 \tabularnewline
35 & -0.087807 & -1.005 & 0.158376 \tabularnewline
36 & -0.022357 & -0.2559 & 0.39922 \tabularnewline
37 & 0.030163 & 0.3452 & 0.365238 \tabularnewline
38 & -0.025474 & -0.2916 & 0.385542 \tabularnewline
39 & 0.021514 & 0.2462 & 0.402943 \tabularnewline
40 & 0.004753 & 0.0544 & 0.478349 \tabularnewline
41 & -0.018852 & -0.2158 & 0.41475 \tabularnewline
42 & 0.000921 & 0.0105 & 0.495802 \tabularnewline
43 & -0.046103 & -0.5277 & 0.299311 \tabularnewline
44 & 0.057093 & 0.6535 & 0.257304 \tabularnewline
45 & 0.0228 & 0.261 & 0.397268 \tabularnewline
46 & 0.09983 & 1.1426 & 0.127643 \tabularnewline
47 & 0.043843 & 0.5018 & 0.308324 \tabularnewline
48 & 0.051218 & 0.5862 & 0.27937 \tabularnewline
\hline
\end{tabular}
%Source: https://freestatistics.org/blog/index.php?pk=203030&T=2

[TABLE]
[ROW][C]Partial Autocorrelation Function[/C][/ROW]
[ROW][C]Time lag k[/C][C]PACF(k)[/C][C]T-STAT[/C][C]P-value[/C][/ROW]
[ROW][C]1[/C][C]-0.265081[/C][C]-3.034[/C][C]0.001456[/C][/ROW]
[ROW][C]2[/C][C]-0.594818[/C][C]-6.808[/C][C]0[/C][/ROW]
[ROW][C]3[/C][C]-0.11138[/C][C]-1.2748[/C][C]0.102319[/C][/ROW]
[ROW][C]4[/C][C]-0.311569[/C][C]-3.5661[/C][C]0.000253[/C][/ROW]
[ROW][C]5[/C][C]-0.263918[/C][C]-3.0207[/C][C]0.001517[/C][/ROW]
[ROW][C]6[/C][C]0.0073[/C][C]0.0836[/C][C]0.466769[/C][/ROW]
[ROW][C]7[/C][C]-0.369779[/C][C]-4.2323[/C][C]2.2e-05[/C][/ROW]
[ROW][C]8[/C][C]0.064939[/C][C]0.7433[/C][C]0.229327[/C][/ROW]
[ROW][C]9[/C][C]0.12091[/C][C]1.3839[/C][C]0.084375[/C][/ROW]
[ROW][C]10[/C][C]-0.436984[/C][C]-5.0015[/C][C]1e-06[/C][/ROW]
[ROW][C]11[/C][C]-0.656913[/C][C]-7.5187[/C][C]0[/C][/ROW]
[ROW][C]12[/C][C]0.073224[/C][C]0.8381[/C][C]0.201753[/C][/ROW]
[ROW][C]13[/C][C]0.011874[/C][C]0.1359[/C][C]0.446054[/C][/ROW]
[ROW][C]14[/C][C]0.047739[/C][C]0.5464[/C][C]0.29286[/C][/ROW]
[ROW][C]15[/C][C]0.038879[/C][C]0.445[/C][C]0.328531[/C][/ROW]
[ROW][C]16[/C][C]0.005536[/C][C]0.0634[/C][C]0.474786[/C][/ROW]
[ROW][C]17[/C][C]0.076717[/C][C]0.8781[/C][C]0.190759[/C][/ROW]
[ROW][C]18[/C][C]0.145866[/C][C]1.6695[/C][C]0.048702[/C][/ROW]
[ROW][C]19[/C][C]0.123308[/C][C]1.4113[/C][C]0.08026[/C][/ROW]
[ROW][C]20[/C][C]0.083649[/C][C]0.9574[/C][C]0.170063[/C][/ROW]
[ROW][C]21[/C][C]0.029915[/C][C]0.3424[/C][C]0.366302[/C][/ROW]
[ROW][C]22[/C][C]0.007987[/C][C]0.0914[/C][C]0.46365[/C][/ROW]
[ROW][C]23[/C][C]-0.138352[/C][C]-1.5835[/C][C]0.057859[/C][/ROW]
[ROW][C]24[/C][C]-0.128389[/C][C]-1.4695[/C][C]0.072051[/C][/ROW]
[ROW][C]25[/C][C]0.005921[/C][C]0.0678[/C][C]0.473037[/C][/ROW]
[ROW][C]26[/C][C]0.007788[/C][C]0.0891[/C][C]0.464552[/C][/ROW]
[ROW][C]27[/C][C]-0.030364[/C][C]-0.3475[/C][C]0.364373[/C][/ROW]
[ROW][C]28[/C][C]-0.031731[/C][C]-0.3632[/C][C]0.358528[/C][/ROW]
[ROW][C]29[/C][C]0.059675[/C][C]0.683[/C][C]0.247903[/C][/ROW]
[ROW][C]30[/C][C]-0.095102[/C][C]-1.0885[/C][C]0.139189[/C][/ROW]
[ROW][C]31[/C][C]0.020326[/C][C]0.2326[/C][C]0.408201[/C][/ROW]
[ROW][C]32[/C][C]-0.069151[/C][C]-0.7915[/C][C]0.215052[/C][/ROW]
[ROW][C]33[/C][C]-0.066557[/C][C]-0.7618[/C][C]0.223779[/C][/ROW]
[ROW][C]34[/C][C]0.018934[/C][C]0.2167[/C][C]0.414388[/C][/ROW]
[ROW][C]35[/C][C]-0.087807[/C][C]-1.005[/C][C]0.158376[/C][/ROW]
[ROW][C]36[/C][C]-0.022357[/C][C]-0.2559[/C][C]0.39922[/C][/ROW]
[ROW][C]37[/C][C]0.030163[/C][C]0.3452[/C][C]0.365238[/C][/ROW]
[ROW][C]38[/C][C]-0.025474[/C][C]-0.2916[/C][C]0.385542[/C][/ROW]
[ROW][C]39[/C][C]0.021514[/C][C]0.2462[/C][C]0.402943[/C][/ROW]
[ROW][C]40[/C][C]0.004753[/C][C]0.0544[/C][C]0.478349[/C][/ROW]
[ROW][C]41[/C][C]-0.018852[/C][C]-0.2158[/C][C]0.41475[/C][/ROW]
[ROW][C]42[/C][C]0.000921[/C][C]0.0105[/C][C]0.495802[/C][/ROW]
[ROW][C]43[/C][C]-0.046103[/C][C]-0.5277[/C][C]0.299311[/C][/ROW]
[ROW][C]44[/C][C]0.057093[/C][C]0.6535[/C][C]0.257304[/C][/ROW]
[ROW][C]45[/C][C]0.0228[/C][C]0.261[/C][C]0.397268[/C][/ROW]
[ROW][C]46[/C][C]0.09983[/C][C]1.1426[/C][C]0.127643[/C][/ROW]
[ROW][C]47[/C][C]0.043843[/C][C]0.5018[/C][C]0.308324[/C][/ROW]
[ROW][C]48[/C][C]0.051218[/C][C]0.5862[/C][C]0.27937[/C][/ROW]
[/TABLE]
Source: https://freestatistics.org/blog/index.php?pk=203030&T=2

Globally Unique Identifier (entire table): ba.freestatistics.org/blog/index.php?pk=203030&T=2

As an alternative you can also use a QR Code:  

The GUIDs for individual cells are displayed in the table below:

Partial Autocorrelation Function
Time lag kPACF(k)T-STATP-value
1-0.265081-3.0340.001456
2-0.594818-6.8080
3-0.11138-1.27480.102319
4-0.311569-3.56610.000253
5-0.263918-3.02070.001517
60.00730.08360.466769
7-0.369779-4.23232.2e-05
80.0649390.74330.229327
90.120911.38390.084375
10-0.436984-5.00151e-06
11-0.656913-7.51870
120.0732240.83810.201753
130.0118740.13590.446054
140.0477390.54640.29286
150.0388790.4450.328531
160.0055360.06340.474786
170.0767170.87810.190759
180.1458661.66950.048702
190.1233081.41130.08026
200.0836490.95740.170063
210.0299150.34240.366302
220.0079870.09140.46365
23-0.138352-1.58350.057859
24-0.128389-1.46950.072051
250.0059210.06780.473037
260.0077880.08910.464552
27-0.030364-0.34750.364373
28-0.031731-0.36320.358528
290.0596750.6830.247903
30-0.095102-1.08850.139189
310.0203260.23260.408201
32-0.069151-0.79150.215052
33-0.066557-0.76180.223779
340.0189340.21670.414388
35-0.087807-1.0050.158376
36-0.022357-0.25590.39922
370.0301630.34520.365238
38-0.025474-0.29160.385542
390.0215140.24620.402943
400.0047530.05440.478349
41-0.018852-0.21580.41475
420.0009210.01050.495802
43-0.046103-0.52770.299311
440.0570930.65350.257304
450.02280.2610.397268
460.099831.14260.127643
470.0438430.50180.308324
480.0512180.58620.27937


Parameters (Session):
par1 = 48 ; par2 = 1 ; par3 = 1 ; par4 = 0 ; par5 = 12 ; par6 = White Noise ; par7 = 0.95 ;
Parameters (R input):
par1 = 48 ; par2 = 1 ; par3 = 1 ; par4 = 0 ; par5 = 12 ; par6 = White Noise ; par7 = 0.95 ; par8 = ; par9 = ; par10 = ; par11 = ; par12 = ; par13 = ; par14 = ; par15 = ; par16 = ; par17 = ; par18 = ; par19 = ; par20 = ;
R code (references can be found in the software module):
if (par1 == 'Default') {
par1 = 10*log10(length(x))
} else {
par1 <- as.numeric(par1)
}
par2 <- as.numeric(par2)
par3 <- as.numeric(par3)
par4 <- as.numeric(par4)
par5 <- as.numeric(par5)
if (par6 == 'White Noise') par6 <- 'white' else par6 <- 'ma'
par7 <- as.numeric(par7)
if (par8 != '') par8 <- as.numeric(par8)
ox <- x
if (par8 == '') {
if (par2 == 0) {
x <- log(x)
} else {
x <- (x ^ par2 - 1) / par2
}
} else {
x <- log(x,base=par8)
}
if (par3 > 0) x <- diff(x,lag=1,difference=par3)
if (par4 > 0) x <- diff(x,lag=par5,difference=par4)
bitmap(file='picts.png')
op <- par(mfrow=c(2,1))
plot(ox,type='l',main='Original Time Series',xlab='time',ylab='value')
if (par8=='') {
mytitle <- paste('Working Time Series (lambda=',par2,', d=',par3,', D=',par4,')',sep='')
mysub <- paste('(lambda=',par2,', d=',par3,', D=',par4,', CI=', par7, ', CI type=',par6,')',sep='')
} else {
mytitle <- paste('Working Time Series (base=',par8,', d=',par3,', D=',par4,')',sep='')
mysub <- paste('(base=',par8,', d=',par3,', D=',par4,', CI=', par7, ', CI type=',par6,')',sep='')
}
plot(x,type='l', main=mytitle,xlab='time',ylab='value')
par(op)
dev.off()
bitmap(file='pic1.png')
racf <- acf(x, par1, main='Autocorrelation', xlab='time lag', ylab='ACF', ci.type=par6, ci=par7, sub=mysub)
dev.off()
bitmap(file='pic2.png')
rpacf <- pacf(x,par1,main='Partial Autocorrelation',xlab='lags',ylab='PACF',sub=mysub)
dev.off()
(myacf <- c(racf$acf))
(mypacf <- c(rpacf$acf))
lengthx <- length(x)
sqrtn <- sqrt(lengthx)
load(file='createtable')
a<-table.start()
a<-table.row.start(a)
a<-table.element(a,'Autocorrelation Function',4,TRUE)
a<-table.row.end(a)
a<-table.row.start(a)
a<-table.element(a,'Time lag k',header=TRUE)
a<-table.element(a,hyperlink('basics.htm','ACF(k)','click here for more information about the Autocorrelation Function'),header=TRUE)
a<-table.element(a,'T-STAT',header=TRUE)
a<-table.element(a,'P-value',header=TRUE)
a<-table.row.end(a)
for (i in 2:(par1+1)) {
a<-table.row.start(a)
a<-table.element(a,i-1,header=TRUE)
a<-table.element(a,round(myacf[i],6))
mytstat <- myacf[i]*sqrtn
a<-table.element(a,round(mytstat,4))
a<-table.element(a,round(1-pt(abs(mytstat),lengthx),6))
a<-table.row.end(a)
}
a<-table.end(a)
table.save(a,file='mytable.tab')
a<-table.start()
a<-table.row.start(a)
a<-table.element(a,'Partial Autocorrelation Function',4,TRUE)
a<-table.row.end(a)
a<-table.row.start(a)
a<-table.element(a,'Time lag k',header=TRUE)
a<-table.element(a,hyperlink('basics.htm','PACF(k)','click here for more information about the Partial Autocorrelation Function'),header=TRUE)
a<-table.element(a,'T-STAT',header=TRUE)
a<-table.element(a,'P-value',header=TRUE)
a<-table.row.end(a)
for (i in 1:par1) {
a<-table.row.start(a)
a<-table.element(a,i,header=TRUE)
a<-table.element(a,round(mypacf[i],6))
mytstat <- mypacf[i]*sqrtn
a<-table.element(a,round(mytstat,4))
a<-table.element(a,round(1-pt(abs(mytstat),lengthx),6))
a<-table.row.end(a)
}
a<-table.end(a)
table.save(a,file='mytable1.tab')