Free Statistics

of Irreproducible Research!

Author's title

Author*The author of this computation has been verified*
R Software Modulerwasp_smp.wasp
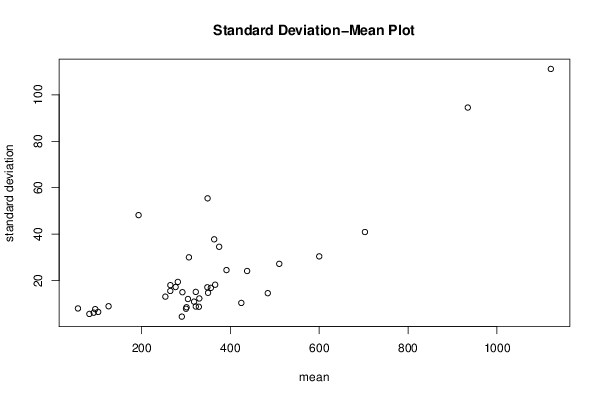
Title produced by softwareStandard Deviation-Mean Plot
Date of computationThu, 20 Dec 2012 12:58:59 -0500
Cite this page as followsStatistical Computations at FreeStatistics.org, Office for Research Development and Education, URL https://freestatistics.org/blog/index.php?v=date/2012/Dec/20/t1356026356vo9f34c6k9z3jw1.htm/, Retrieved Fri, 26 Apr 2024 09:19:44 +0000
Statistical Computations at FreeStatistics.org, Office for Research Development and Education, URL https://freestatistics.org/blog/index.php?pk=202969, Retrieved Fri, 26 Apr 2024 09:19:44 +0000
QR Codes:

Original text written by user:
IsPrivate?No (this computation is public)
User-defined keywords
Estimated Impact75
Family? (F = Feedback message, R = changed R code, M = changed R Module, P = changed Parameters, D = changed Data)
-     [Standard Deviation-Mean Plot] [sdmp] [2011-12-21 13:30:50] [26f9350dcf28f408b6e37deed68b781e]
- R  D    [Standard Deviation-Mean Plot] [lambda bepalen] [2012-12-20 17:58:59] [3d604e7f846c7f85ca2541c807d08ff8] [Current]
Feedback Forum

Post a new message
Dataseries X:
41
48
52
53
65
68
64
57
55
54
59
66
83
100
101
98
92
85
92
94
90
99
108
106
99
100
99
93
92
93
98
95
86
85
83
85
80
84
86
87
85
83
76
70
78
83
88
90
90
97
102
101
98
98
100
102
108
112
110
110
117
120
119
113
123
120
129
132
136
141
122
137
145
155
148
153
172
169
180
190
233
231
245
299
385
381
322
317
323
393
372
387
413
405
407
392
363
358
375
370
386
353
347
363
350
347
333
327
328
309
286
319
285
301
315
388
383
417
423
430
486
394
411
431
447
432
457
453
441
416
451
432
436
429
421
425
437
432
413
419
436
421
424
402
403
400
426
418
403
405
394
400
376
367
354
348
364
329
348
330
351
336
332
349
384
370
346
338
335
338
347
372
376
373
392
374
385
372
372
352
353
330
348
346
361
364
375
369
342
338
337
333
336
322
329
322
325
331
311
318
312
315
333
311
321
316
284
281
280
266
268
278
292
263
265
266
251
256
280
283
289
308
293
281
274
277
278
250
265
269
262
258
251
243
247
224
241
255
261
267
264
270
275
281
301
321
355
319
299
319
328
348
335
333
331
318
325
318
313
313
315
298
311
309
297
294
291
292
290
287
281
295
289
286
295
291
315
306
304
309
307
299
294
295
296
294
292
290
289
310
297
301
302
297
305
298
299
273
267
266
284
276
284
285
267
273
262
246
251
248
255
245
251
261
259
271
258
253
239
241
281
285
289
290
290
305
289
302
294
301
299
312
310
312
309
292
284
290
292
297
316
320
304
301
322
309
308
311
328
343
345
342
350
322
311
319
328
320
321
331
342
322
307
302
307
301
315
342
333
332
332
330
322
319
345
324
322
325
325
335
335
335
341
320
324
328
329
338
336
361
353
352
393
393
420
435
468
466
481
511
508
480
496
487
473
473
488
479
501
503
497
496
490
482
486
493
522
546
534
570
624
640
589
559
570
590
588
566
630
576
642
626
718
750
690
667
689
666
662
666
681
705
783
758
776
812
824
887
984
1016
897
980
957
969
1063
1048
968
1022
1014
1035
1069
1038
1133
1260
1207
1235
1297
1179
1332
1323
1248
1248
1260
1260
1317
1308
1380
1327
1327


Summary of computational transaction
Raw Inputview raw input (R code)
Raw Outputview raw output of R engine
Computing time3 seconds
R Server'Gwilym Jenkins' @ jenkins.wessa.net

\begin{tabular}{lllllllll}
\hline
Summary of computational transaction \tabularnewline
Raw Input & view raw input (R code)  \tabularnewline
Raw Output & view raw output of R engine  \tabularnewline
Computing time & 3 seconds \tabularnewline
R Server & 'Gwilym Jenkins' @ jenkins.wessa.net \tabularnewline
\hline
\end{tabular}
%Source: https://freestatistics.org/blog/index.php?pk=202969&T=0

[TABLE]
[ROW][C]Summary of computational transaction[/C][/ROW]
[ROW][C]Raw Input[/C][C]view raw input (R code) [/C][/ROW]
[ROW][C]Raw Output[/C][C]view raw output of R engine [/C][/ROW]
[ROW][C]Computing time[/C][C]3 seconds[/C][/ROW]
[ROW][C]R Server[/C][C]'Gwilym Jenkins' @ jenkins.wessa.net[/C][/ROW]
[/TABLE]
Source: https://freestatistics.org/blog/index.php?pk=202969&T=0

Globally Unique Identifier (entire table): ba.freestatistics.org/blog/index.php?pk=202969&T=0

As an alternative you can also use a QR Code:  

The GUIDs for individual cells are displayed in the table below:

Summary of computational transaction
Raw Inputview raw input (R code)
Raw Outputview raw output of R engine
Computing time3 seconds
R Server'Gwilym Jenkins' @ jenkins.wessa.net


Standard Deviation-Mean Plot
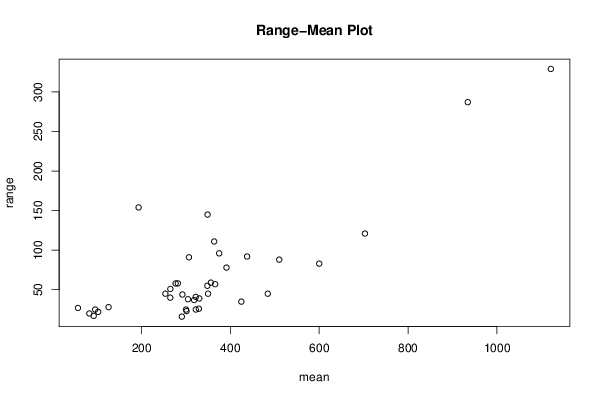
SectionMeanStandard DeviationRange
156.83333333333338.0321324388453427
295.66666666666677.7381385280174425
392.33333333333336.1987290975039717
482.55.6648838550237820
5102.3333333333336.5273318136939122
6125.758.9759780424297928
7193.33333333333348.1953097177296154
8374.7534.570415623241296
935616.884635296354859
10348.66666666666755.4343728833447145
11437.58333333333324.152765071644792
12424.58333333333310.405054133215835
13391.16666666666724.5461840520178
14348.08333333333317.148858076657355
15365.66666666666718.2374905238157
16349.66666666666714.76071772912145
17322.0833333333338.857029394609125
18281.66666666666719.443780652450458
19276.66666666666717.259165329725258
20253.58333333333313.111121811329345
21306.66666666666730.040376868878491
22318.2510.955488454319537
23290.6666666666674.4991581704163616
24300.0833333333337.8908270488682925
2529215.01514387059144
26264.66666666666715.564139045974440
27264.83333333333318.054630900954451
28301.258.5400127741015823
29304.512.094326243025238
3033012.336199503162239
31322.08333333333315.150507542253541
323298.7594105239606626
33363.537.7924956475849111
34484.16666666666714.602822475207545
3551027.236339361562288
3660030.442195596363883
37702.91666666666740.9288925140205121
38934.41666666666794.5106615759045287
391121.41666666667111.127656596394329

\begin{tabular}{lllllllll}
\hline
Standard Deviation-Mean Plot \tabularnewline
Section & Mean & Standard Deviation & Range \tabularnewline
1 & 56.8333333333333 & 8.03213243884534 & 27 \tabularnewline
2 & 95.6666666666667 & 7.73813852801744 & 25 \tabularnewline
3 & 92.3333333333333 & 6.19872909750397 & 17 \tabularnewline
4 & 82.5 & 5.66488385502378 & 20 \tabularnewline
5 & 102.333333333333 & 6.52733181369391 & 22 \tabularnewline
6 & 125.75 & 8.97597804242979 & 28 \tabularnewline
7 & 193.333333333333 & 48.1953097177296 & 154 \tabularnewline
8 & 374.75 & 34.5704156232412 & 96 \tabularnewline
9 & 356 & 16.8846352963548 & 59 \tabularnewline
10 & 348.666666666667 & 55.4343728833447 & 145 \tabularnewline
11 & 437.583333333333 & 24.1527650716447 & 92 \tabularnewline
12 & 424.583333333333 & 10.4050541332158 & 35 \tabularnewline
13 & 391.166666666667 & 24.54618405201 & 78 \tabularnewline
14 & 348.083333333333 & 17.1488580766573 & 55 \tabularnewline
15 & 365.666666666667 & 18.23749052381 & 57 \tabularnewline
16 & 349.666666666667 & 14.760717729121 & 45 \tabularnewline
17 & 322.083333333333 & 8.8570293946091 & 25 \tabularnewline
18 & 281.666666666667 & 19.4437806524504 & 58 \tabularnewline
19 & 276.666666666667 & 17.2591653297252 & 58 \tabularnewline
20 & 253.583333333333 & 13.1111218113293 & 45 \tabularnewline
21 & 306.666666666667 & 30.0403768688784 & 91 \tabularnewline
22 & 318.25 & 10.9554884543195 & 37 \tabularnewline
23 & 290.666666666667 & 4.49915817041636 & 16 \tabularnewline
24 & 300.083333333333 & 7.89082704886829 & 25 \tabularnewline
25 & 292 & 15.015143870591 & 44 \tabularnewline
26 & 264.666666666667 & 15.5641390459744 & 40 \tabularnewline
27 & 264.833333333333 & 18.0546309009544 & 51 \tabularnewline
28 & 301.25 & 8.54001277410158 & 23 \tabularnewline
29 & 304.5 & 12.0943262430252 & 38 \tabularnewline
30 & 330 & 12.3361995031622 & 39 \tabularnewline
31 & 322.083333333333 & 15.1505075422535 & 41 \tabularnewline
32 & 329 & 8.75941052396066 & 26 \tabularnewline
33 & 363.5 & 37.7924956475849 & 111 \tabularnewline
34 & 484.166666666667 & 14.6028224752075 & 45 \tabularnewline
35 & 510 & 27.2363393615622 & 88 \tabularnewline
36 & 600 & 30.4421955963638 & 83 \tabularnewline
37 & 702.916666666667 & 40.9288925140205 & 121 \tabularnewline
38 & 934.416666666667 & 94.5106615759045 & 287 \tabularnewline
39 & 1121.41666666667 & 111.127656596394 & 329 \tabularnewline
\hline
\end{tabular}
%Source: https://freestatistics.org/blog/index.php?pk=202969&T=1

[TABLE]
[ROW][C]Standard Deviation-Mean Plot[/C][/ROW]
[ROW][C]Section[/C][C]Mean[/C][C]Standard Deviation[/C][C]Range[/C][/ROW]
[ROW][C]1[/C][C]56.8333333333333[/C][C]8.03213243884534[/C][C]27[/C][/ROW]
[ROW][C]2[/C][C]95.6666666666667[/C][C]7.73813852801744[/C][C]25[/C][/ROW]
[ROW][C]3[/C][C]92.3333333333333[/C][C]6.19872909750397[/C][C]17[/C][/ROW]
[ROW][C]4[/C][C]82.5[/C][C]5.66488385502378[/C][C]20[/C][/ROW]
[ROW][C]5[/C][C]102.333333333333[/C][C]6.52733181369391[/C][C]22[/C][/ROW]
[ROW][C]6[/C][C]125.75[/C][C]8.97597804242979[/C][C]28[/C][/ROW]
[ROW][C]7[/C][C]193.333333333333[/C][C]48.1953097177296[/C][C]154[/C][/ROW]
[ROW][C]8[/C][C]374.75[/C][C]34.5704156232412[/C][C]96[/C][/ROW]
[ROW][C]9[/C][C]356[/C][C]16.8846352963548[/C][C]59[/C][/ROW]
[ROW][C]10[/C][C]348.666666666667[/C][C]55.4343728833447[/C][C]145[/C][/ROW]
[ROW][C]11[/C][C]437.583333333333[/C][C]24.1527650716447[/C][C]92[/C][/ROW]
[ROW][C]12[/C][C]424.583333333333[/C][C]10.4050541332158[/C][C]35[/C][/ROW]
[ROW][C]13[/C][C]391.166666666667[/C][C]24.54618405201[/C][C]78[/C][/ROW]
[ROW][C]14[/C][C]348.083333333333[/C][C]17.1488580766573[/C][C]55[/C][/ROW]
[ROW][C]15[/C][C]365.666666666667[/C][C]18.23749052381[/C][C]57[/C][/ROW]
[ROW][C]16[/C][C]349.666666666667[/C][C]14.760717729121[/C][C]45[/C][/ROW]
[ROW][C]17[/C][C]322.083333333333[/C][C]8.8570293946091[/C][C]25[/C][/ROW]
[ROW][C]18[/C][C]281.666666666667[/C][C]19.4437806524504[/C][C]58[/C][/ROW]
[ROW][C]19[/C][C]276.666666666667[/C][C]17.2591653297252[/C][C]58[/C][/ROW]
[ROW][C]20[/C][C]253.583333333333[/C][C]13.1111218113293[/C][C]45[/C][/ROW]
[ROW][C]21[/C][C]306.666666666667[/C][C]30.0403768688784[/C][C]91[/C][/ROW]
[ROW][C]22[/C][C]318.25[/C][C]10.9554884543195[/C][C]37[/C][/ROW]
[ROW][C]23[/C][C]290.666666666667[/C][C]4.49915817041636[/C][C]16[/C][/ROW]
[ROW][C]24[/C][C]300.083333333333[/C][C]7.89082704886829[/C][C]25[/C][/ROW]
[ROW][C]25[/C][C]292[/C][C]15.015143870591[/C][C]44[/C][/ROW]
[ROW][C]26[/C][C]264.666666666667[/C][C]15.5641390459744[/C][C]40[/C][/ROW]
[ROW][C]27[/C][C]264.833333333333[/C][C]18.0546309009544[/C][C]51[/C][/ROW]
[ROW][C]28[/C][C]301.25[/C][C]8.54001277410158[/C][C]23[/C][/ROW]
[ROW][C]29[/C][C]304.5[/C][C]12.0943262430252[/C][C]38[/C][/ROW]
[ROW][C]30[/C][C]330[/C][C]12.3361995031622[/C][C]39[/C][/ROW]
[ROW][C]31[/C][C]322.083333333333[/C][C]15.1505075422535[/C][C]41[/C][/ROW]
[ROW][C]32[/C][C]329[/C][C]8.75941052396066[/C][C]26[/C][/ROW]
[ROW][C]33[/C][C]363.5[/C][C]37.7924956475849[/C][C]111[/C][/ROW]
[ROW][C]34[/C][C]484.166666666667[/C][C]14.6028224752075[/C][C]45[/C][/ROW]
[ROW][C]35[/C][C]510[/C][C]27.2363393615622[/C][C]88[/C][/ROW]
[ROW][C]36[/C][C]600[/C][C]30.4421955963638[/C][C]83[/C][/ROW]
[ROW][C]37[/C][C]702.916666666667[/C][C]40.9288925140205[/C][C]121[/C][/ROW]
[ROW][C]38[/C][C]934.416666666667[/C][C]94.5106615759045[/C][C]287[/C][/ROW]
[ROW][C]39[/C][C]1121.41666666667[/C][C]111.127656596394[/C][C]329[/C][/ROW]
[/TABLE]
Source: https://freestatistics.org/blog/index.php?pk=202969&T=1

Globally Unique Identifier (entire table): ba.freestatistics.org/blog/index.php?pk=202969&T=1

As an alternative you can also use a QR Code:  

The GUIDs for individual cells are displayed in the table below:

Standard Deviation-Mean Plot
SectionMeanStandard DeviationRange
156.83333333333338.0321324388453427
295.66666666666677.7381385280174425
392.33333333333336.1987290975039717
482.55.6648838550237820
5102.3333333333336.5273318136939122
6125.758.9759780424297928
7193.33333333333348.1953097177296154
8374.7534.570415623241296
935616.884635296354859
10348.66666666666755.4343728833447145
11437.58333333333324.152765071644792
12424.58333333333310.405054133215835
13391.16666666666724.5461840520178
14348.08333333333317.148858076657355
15365.66666666666718.2374905238157
16349.66666666666714.76071772912145
17322.0833333333338.857029394609125
18281.66666666666719.443780652450458
19276.66666666666717.259165329725258
20253.58333333333313.111121811329345
21306.66666666666730.040376868878491
22318.2510.955488454319537
23290.6666666666674.4991581704163616
24300.0833333333337.8908270488682925
2529215.01514387059144
26264.66666666666715.564139045974440
27264.83333333333318.054630900954451
28301.258.5400127741015823
29304.512.094326243025238
3033012.336199503162239
31322.08333333333315.150507542253541
323298.7594105239606626
33363.537.7924956475849111
34484.16666666666714.602822475207545
3551027.236339361562288
3660030.442195596363883
37702.91666666666740.9288925140205121
38934.41666666666794.5106615759045287
391121.41666666667111.127656596394329


Regression: S.E.(k) = alpha + beta * Mean(k)
alpha-7.87351958652492
beta0.0872842020651113
S.D.0.0102962449665075
T-STAT8.47728490814243
p-value3.37965543220944e-10

\begin{tabular}{lllllllll}
\hline
Regression: S.E.(k) = alpha + beta * Mean(k) \tabularnewline
alpha & -7.87351958652492 \tabularnewline
beta & 0.0872842020651113 \tabularnewline
S.D. & 0.0102962449665075 \tabularnewline
T-STAT & 8.47728490814243 \tabularnewline
p-value & 3.37965543220944e-10 \tabularnewline
\hline
\end{tabular}
%Source: https://freestatistics.org/blog/index.php?pk=202969&T=2

[TABLE]
[ROW][C]Regression: S.E.(k) = alpha + beta * Mean(k)[/C][/ROW]
[ROW][C]alpha[/C][C]-7.87351958652492[/C][/ROW]
[ROW][C]beta[/C][C]0.0872842020651113[/C][/ROW]
[ROW][C]S.D.[/C][C]0.0102962449665075[/C][/ROW]
[ROW][C]T-STAT[/C][C]8.47728490814243[/C][/ROW]
[ROW][C]p-value[/C][C]3.37965543220944e-10[/C][/ROW]
[/TABLE]
Source: https://freestatistics.org/blog/index.php?pk=202969&T=2

Globally Unique Identifier (entire table): ba.freestatistics.org/blog/index.php?pk=202969&T=2

As an alternative you can also use a QR Code:  

The GUIDs for individual cells are displayed in the table below:

Regression: S.E.(k) = alpha + beta * Mean(k)
alpha-7.87351958652492
beta0.0872842020651113
S.D.0.0102962449665075
T-STAT8.47728490814243
p-value3.37965543220944e-10


Regression: ln S.E.(k) = alpha + beta * ln Mean(k)
alpha-1.88660545665165
beta0.825349173616136
S.D.0.14428633714742
T-STAT5.72021710394422
p-value1.50267745907885e-06
Lambda0.174650826383864

\begin{tabular}{lllllllll}
\hline
Regression: ln S.E.(k) = alpha + beta * ln Mean(k) \tabularnewline
alpha & -1.88660545665165 \tabularnewline
beta & 0.825349173616136 \tabularnewline
S.D. & 0.14428633714742 \tabularnewline
T-STAT & 5.72021710394422 \tabularnewline
p-value & 1.50267745907885e-06 \tabularnewline
Lambda & 0.174650826383864 \tabularnewline
\hline
\end{tabular}
%Source: https://freestatistics.org/blog/index.php?pk=202969&T=3

[TABLE]
[ROW][C]Regression: ln S.E.(k) = alpha + beta * ln Mean(k)[/C][/ROW]
[ROW][C]alpha[/C][C]-1.88660545665165[/C][/ROW]
[ROW][C]beta[/C][C]0.825349173616136[/C][/ROW]
[ROW][C]S.D.[/C][C]0.14428633714742[/C][/ROW]
[ROW][C]T-STAT[/C][C]5.72021710394422[/C][/ROW]
[ROW][C]p-value[/C][C]1.50267745907885e-06[/C][/ROW]
[ROW][C]Lambda[/C][C]0.174650826383864[/C][/ROW]
[/TABLE]
Source: https://freestatistics.org/blog/index.php?pk=202969&T=3

Globally Unique Identifier (entire table): ba.freestatistics.org/blog/index.php?pk=202969&T=3

As an alternative you can also use a QR Code:  

The GUIDs for individual cells are displayed in the table below:

Regression: ln S.E.(k) = alpha + beta * ln Mean(k)
alpha-1.88660545665165
beta0.825349173616136
S.D.0.14428633714742
T-STAT5.72021710394422
p-value1.50267745907885e-06
Lambda0.174650826383864


Parameters (Session):
par1 = 12 ;
Parameters (R input):
par1 = 12 ;
R code (references can be found in the software module):
par1 <- as.numeric(par1)
(n <- length(x))
(np <- floor(n / par1))
arr <- array(NA,dim=c(par1,np))
j <- 0
k <- 1
for (i in 1:(np*par1))
{
j = j + 1
arr[j,k] <- x[i]
if (j == par1) {
j = 0
k=k+1
}
}
arr
arr.mean <- array(NA,dim=np)
arr.sd <- array(NA,dim=np)
arr.range <- array(NA,dim=np)
for (j in 1:np)
{
arr.mean[j] <- mean(arr[,j],na.rm=TRUE)
arr.sd[j] <- sd(arr[,j],na.rm=TRUE)
arr.range[j] <- max(arr[,j],na.rm=TRUE) - min(arr[,j],na.rm=TRUE)
}
arr.mean
arr.sd
arr.range
(lm1 <- lm(arr.sd~arr.mean))
(lnlm1 <- lm(log(arr.sd)~log(arr.mean)))
(lm2 <- lm(arr.range~arr.mean))
bitmap(file='test1.png')
plot(arr.mean,arr.sd,main='Standard Deviation-Mean Plot',xlab='mean',ylab='standard deviation')
dev.off()
bitmap(file='test2.png')
plot(arr.mean,arr.range,main='Range-Mean Plot',xlab='mean',ylab='range')
dev.off()
load(file='createtable')
a<-table.start()
a<-table.row.start(a)
a<-table.element(a,'Standard Deviation-Mean Plot',4,TRUE)
a<-table.row.end(a)
a<-table.row.start(a)
a<-table.element(a,'Section',header=TRUE)
a<-table.element(a,'Mean',header=TRUE)
a<-table.element(a,'Standard Deviation',header=TRUE)
a<-table.element(a,'Range',header=TRUE)
a<-table.row.end(a)
for (j in 1:np) {
a<-table.row.start(a)
a<-table.element(a,j,header=TRUE)
a<-table.element(a,arr.mean[j])
a<-table.element(a,arr.sd[j] )
a<-table.element(a,arr.range[j] )
a<-table.row.end(a)
}
a<-table.end(a)
table.save(a,file='mytable.tab')
a<-table.start()
a<-table.row.start(a)
a<-table.element(a,'Regression: S.E.(k) = alpha + beta * Mean(k)',2,TRUE)
a<-table.row.end(a)
a<-table.row.start(a)
a<-table.element(a,'alpha',header=TRUE)
a<-table.element(a,lm1$coefficients[[1]])
a<-table.row.end(a)
a<-table.row.start(a)
a<-table.element(a,'beta',header=TRUE)
a<-table.element(a,lm1$coefficients[[2]])
a<-table.row.end(a)
a<-table.row.start(a)
a<-table.element(a,'S.D.',header=TRUE)
a<-table.element(a,summary(lm1)$coefficients[2,2])
a<-table.row.end(a)
a<-table.row.start(a)
a<-table.element(a,'T-STAT',header=TRUE)
a<-table.element(a,summary(lm1)$coefficients[2,3])
a<-table.row.end(a)
a<-table.row.start(a)
a<-table.element(a,'p-value',header=TRUE)
a<-table.element(a,summary(lm1)$coefficients[2,4])
a<-table.row.end(a)
a<-table.end(a)
table.save(a,file='mytable1.tab')
a<-table.start()
a<-table.row.start(a)
a<-table.element(a,'Regression: ln S.E.(k) = alpha + beta * ln Mean(k)',2,TRUE)
a<-table.row.end(a)
a<-table.row.start(a)
a<-table.element(a,'alpha',header=TRUE)
a<-table.element(a,lnlm1$coefficients[[1]])
a<-table.row.end(a)
a<-table.row.start(a)
a<-table.element(a,'beta',header=TRUE)
a<-table.element(a,lnlm1$coefficients[[2]])
a<-table.row.end(a)
a<-table.row.start(a)
a<-table.element(a,'S.D.',header=TRUE)
a<-table.element(a,summary(lnlm1)$coefficients[2,2])
a<-table.row.end(a)
a<-table.row.start(a)
a<-table.element(a,'T-STAT',header=TRUE)
a<-table.element(a,summary(lnlm1)$coefficients[2,3])
a<-table.row.end(a)
a<-table.row.start(a)
a<-table.element(a,'p-value',header=TRUE)
a<-table.element(a,summary(lnlm1)$coefficients[2,4])
a<-table.row.end(a)
a<-table.row.start(a)
a<-table.element(a,'Lambda',header=TRUE)
a<-table.element(a,1-lnlm1$coefficients[[2]])
a<-table.row.end(a)
a<-table.end(a)
table.save(a,file='mytable2.tab')