Free Statistics

of Irreproducible Research!

Author's title

Author*The author of this computation has been verified*
R Software Modulerwasp_multipleregression.wasp
Title produced by softwareMultiple Regression
Date of computationThu, 20 Dec 2012 12:55:31 -0500
Cite this page as followsStatistical Computations at FreeStatistics.org, Office for Research Development and Education, URL https://freestatistics.org/blog/index.php?v=date/2012/Dec/20/t1356026167cmxpswhermvqw9a.htm/, Retrieved Thu, 25 Apr 2024 19:02:04 +0000
Statistical Computations at FreeStatistics.org, Office for Research Development and Education, URL https://freestatistics.org/blog/index.php?pk=202967, Retrieved Thu, 25 Apr 2024 19:02:04 +0000
QR Codes:

Original text written by user:
IsPrivate?No (this computation is public)
User-defined keywords
Estimated Impact147
Family? (F = Feedback message, R = changed R code, M = changed R Module, P = changed Parameters, D = changed Data)
-     [One-Way-Between-Groups ANOVA- Free Statistics Software (Calculator)] [] [2010-11-01 13:37:53] [b98453cac15ba1066b407e146608df68]
- R PD  [One-Way-Between-Groups ANOVA- Free Statistics Software (Calculator)] [paper 1way anova] [2012-12-11 12:19:36] [e01c78beec4051e03ee053d8bc2c6384]
- RMPD    [Multiple Regression] [paper deel 5 rfc ...] [2012-12-18 19:54:25] [e01c78beec4051e03ee053d8bc2c6384]
- R  D        [Multiple Regression] [paper rfc multipl...] [2012-12-20 17:55:31] [074a00bbc2315ea54a3f557bcf69eecf] [Current]
Feedback Forum

Post a new message
Dataseries X:
0	0	0	0	1
1	1	0	0	1
0	0	0	0	0
0	0	0	0	1
0	0	0	1	0
1	0	0	0	0
0	0	0	1	0
0	0	0	0	0
1	0	0	0	0
0	0	0	0	1
1	0	0	0	0
0	0	0	0	0
0	0	0	0	0
0	0	0	0	1
0	0	0	0	1
0	0	0	0	0
0	0	0	0	0
0	0	0	0	0
1	1	0	0	0
0	0	0	0	0
0	0	0	0	0
1	1	0	0	0
0	0	0	0	0
0	0	0	0	0
1	1	0	1	0
1	0	0	0	0
0	1	0	0	0
1	1	0	0	0
0	0	0	0	0
0	0	0	0	0
0	0	0	0	1
0	0	0	0	0
0	0	0	0	0
0	0	0	0	1
0	0	0	0	0
0	0	0	0	0
1	1	0	0	0
0	1	0	1	1
0	0	0	0	1
1	0	0	0	0
0	0	0	1	0
0	0	0	0	1
0	0	0	0	0
0	0	0	0	1
0	0	0	0	0
0	0	0	0	1
0	1	0	0	0
0	0	0	0	0
0	0	0	0	0
0	0	0	0	0
0	1	0	1	1
1	1	0	1	1
1	0	0	0	0
0	0	0	0	0
0	1	1	0	1
1	1	0	0	1
0	0	0	0	0
0	0	0	1	1
0	0	0	1	0
1	0	0	0	1
1	1	0	0	0
1	0	0	0	0
0	0	0	0	0
0	0	0	1	1
0	0	0	0	1
0	1	1	0	0
0	1	1	1	0
0	1	0	0	0


Summary of computational transaction
Raw Inputview raw input (R code)
Raw Outputview raw output of R engine
Computing time8 seconds
R Server'Gertrude Mary Cox' @ cox.wessa.net

\begin{tabular}{lllllllll}
\hline
Summary of computational transaction \tabularnewline
Raw Input & view raw input (R code)  \tabularnewline
Raw Output & view raw output of R engine  \tabularnewline
Computing time & 8 seconds \tabularnewline
R Server & 'Gertrude Mary Cox' @ cox.wessa.net \tabularnewline
\hline
\end{tabular}
%Source: https://freestatistics.org/blog/index.php?pk=202967&T=0

[TABLE]
[ROW][C]Summary of computational transaction[/C][/ROW]
[ROW][C]Raw Input[/C][C]view raw input (R code) [/C][/ROW]
[ROW][C]Raw Output[/C][C]view raw output of R engine [/C][/ROW]
[ROW][C]Computing time[/C][C]8 seconds[/C][/ROW]
[ROW][C]R Server[/C][C]'Gertrude Mary Cox' @ cox.wessa.net[/C][/ROW]
[/TABLE]
Source: https://freestatistics.org/blog/index.php?pk=202967&T=0

Globally Unique Identifier (entire table): ba.freestatistics.org/blog/index.php?pk=202967&T=0

As an alternative you can also use a QR Code:  

The GUIDs for individual cells are displayed in the table below:

Summary of computational transaction
Raw Inputview raw input (R code)
Raw Outputview raw output of R engine
Computing time8 seconds
R Server'Gertrude Mary Cox' @ cox.wessa.net


Multiple Linear Regression - Estimated Regression Equation
CorrectAnalysis[t] = + 0.0300574681702058 -0.148745130662369T20[t] + 0.234808448116263Used[t] -0.0103178724446289Useful[t] -0.0187375064475848outcome[t] + e[t]

\begin{tabular}{lllllllll}
\hline
Multiple Linear Regression - Estimated Regression Equation \tabularnewline
CorrectAnalysis[t] =  +  0.0300574681702058 -0.148745130662369T20[t] +  0.234808448116263Used[t] -0.0103178724446289Useful[t] -0.0187375064475848outcome[t]  + e[t] \tabularnewline
\hline
\end{tabular}
%Source: https://freestatistics.org/blog/index.php?pk=202967&T=1

[TABLE]
[ROW][C]Multiple Linear Regression - Estimated Regression Equation[/C][/ROW]
[ROW][C]CorrectAnalysis[t] =  +  0.0300574681702058 -0.148745130662369T20[t] +  0.234808448116263Used[t] -0.0103178724446289Useful[t] -0.0187375064475848outcome[t]  + e[t][/C][/ROW]
[/TABLE]
Source: https://freestatistics.org/blog/index.php?pk=202967&T=1

Globally Unique Identifier (entire table): ba.freestatistics.org/blog/index.php?pk=202967&T=1

As an alternative you can also use a QR Code:  

The GUIDs for individual cells are displayed in the table below:

Multiple Linear Regression - Estimated Regression Equation
CorrectAnalysis[t] = + 0.0300574681702058 -0.148745130662369T20[t] + 0.234808448116263Used[t] -0.0103178724446289Useful[t] -0.0187375064475848outcome[t] + e[t]


Multiple Linear Regression - Ordinary Least Squares
VariableParameterS.D.T-STATH0: parameter = 02-tail p-value1-tail p-value
(Intercept)0.03005746817020580.0328070.91620.3630660.181533
T20-0.1487451306623690.057894-2.56930.012570.006285
Used0.2348084481162630.0588573.98950.0001758.8e-05
Useful-0.01031787244462890.064656-0.15960.8737210.436861
outcome-0.01873750644758480.050197-0.37330.7101930.355097

\begin{tabular}{lllllllll}
\hline
Multiple Linear Regression - Ordinary Least Squares \tabularnewline
Variable & Parameter & S.D. & T-STATH0: parameter = 0 & 2-tail p-value & 1-tail p-value \tabularnewline
(Intercept) & 0.0300574681702058 & 0.032807 & 0.9162 & 0.363066 & 0.181533 \tabularnewline
T20 & -0.148745130662369 & 0.057894 & -2.5693 & 0.01257 & 0.006285 \tabularnewline
Used & 0.234808448116263 & 0.058857 & 3.9895 & 0.000175 & 8.8e-05 \tabularnewline
Useful & -0.0103178724446289 & 0.064656 & -0.1596 & 0.873721 & 0.436861 \tabularnewline
outcome & -0.0187375064475848 & 0.050197 & -0.3733 & 0.710193 & 0.355097 \tabularnewline
\hline
\end{tabular}
%Source: https://freestatistics.org/blog/index.php?pk=202967&T=2

[TABLE]
[ROW][C]Multiple Linear Regression - Ordinary Least Squares[/C][/ROW]
[ROW][C]Variable[/C][C]Parameter[/C][C]S.D.[/C][C]T-STATH0: parameter = 0[/C][C]2-tail p-value[/C][C]1-tail p-value[/C][/ROW]
[ROW][C](Intercept)[/C][C]0.0300574681702058[/C][C]0.032807[/C][C]0.9162[/C][C]0.363066[/C][C]0.181533[/C][/ROW]
[ROW][C]T20[/C][C]-0.148745130662369[/C][C]0.057894[/C][C]-2.5693[/C][C]0.01257[/C][C]0.006285[/C][/ROW]
[ROW][C]Used[/C][C]0.234808448116263[/C][C]0.058857[/C][C]3.9895[/C][C]0.000175[/C][C]8.8e-05[/C][/ROW]
[ROW][C]Useful[/C][C]-0.0103178724446289[/C][C]0.064656[/C][C]-0.1596[/C][C]0.873721[/C][C]0.436861[/C][/ROW]
[ROW][C]outcome[/C][C]-0.0187375064475848[/C][C]0.050197[/C][C]-0.3733[/C][C]0.710193[/C][C]0.355097[/C][/ROW]
[/TABLE]
Source: https://freestatistics.org/blog/index.php?pk=202967&T=2

Globally Unique Identifier (entire table): ba.freestatistics.org/blog/index.php?pk=202967&T=2

As an alternative you can also use a QR Code:  

The GUIDs for individual cells are displayed in the table below:

Multiple Linear Regression - Ordinary Least Squares
VariableParameterS.D.T-STATH0: parameter = 02-tail p-value1-tail p-value
(Intercept)0.03005746817020580.0328070.91620.3630660.181533
T20-0.1487451306623690.057894-2.56930.012570.006285
Used0.2348084481162630.0588573.98950.0001758.8e-05
Useful-0.01031787244462890.064656-0.15960.8737210.436861
outcome-0.01873750644758480.050197-0.37330.7101930.355097


Multiple Linear Regression - Regression Statistics
Multiple R0.469898413231829
R-squared0.220804518757791
Adjusted R-squared0.171331789790031
F-TEST (value)4.46315623505802
F-TEST (DF numerator)4
F-TEST (DF denominator)63
p-value0.00307270785024671
Multiple Linear Regression - Residual Statistics
Residual Standard Deviation0.188328387209927
Sum Squared Residuals2.23445763003281

\begin{tabular}{lllllllll}
\hline
Multiple Linear Regression - Regression Statistics \tabularnewline
Multiple R & 0.469898413231829 \tabularnewline
R-squared & 0.220804518757791 \tabularnewline
Adjusted R-squared & 0.171331789790031 \tabularnewline
F-TEST (value) & 4.46315623505802 \tabularnewline
F-TEST (DF numerator) & 4 \tabularnewline
F-TEST (DF denominator) & 63 \tabularnewline
p-value & 0.00307270785024671 \tabularnewline
Multiple Linear Regression - Residual Statistics \tabularnewline
Residual Standard Deviation & 0.188328387209927 \tabularnewline
Sum Squared Residuals & 2.23445763003281 \tabularnewline
\hline
\end{tabular}
%Source: https://freestatistics.org/blog/index.php?pk=202967&T=3

[TABLE]
[ROW][C]Multiple Linear Regression - Regression Statistics[/C][/ROW]
[ROW][C]Multiple R[/C][C]0.469898413231829[/C][/ROW]
[ROW][C]R-squared[/C][C]0.220804518757791[/C][/ROW]
[ROW][C]Adjusted R-squared[/C][C]0.171331789790031[/C][/ROW]
[ROW][C]F-TEST (value)[/C][C]4.46315623505802[/C][/ROW]
[ROW][C]F-TEST (DF numerator)[/C][C]4[/C][/ROW]
[ROW][C]F-TEST (DF denominator)[/C][C]63[/C][/ROW]
[ROW][C]p-value[/C][C]0.00307270785024671[/C][/ROW]
[ROW][C]Multiple Linear Regression - Residual Statistics[/C][/ROW]
[ROW][C]Residual Standard Deviation[/C][C]0.188328387209927[/C][/ROW]
[ROW][C]Sum Squared Residuals[/C][C]2.23445763003281[/C][/ROW]
[/TABLE]
Source: https://freestatistics.org/blog/index.php?pk=202967&T=3

Globally Unique Identifier (entire table): ba.freestatistics.org/blog/index.php?pk=202967&T=3

As an alternative you can also use a QR Code:  

The GUIDs for individual cells are displayed in the table below:

Multiple Linear Regression - Regression Statistics
Multiple R0.469898413231829
R-squared0.220804518757791
Adjusted R-squared0.171331789790031
F-TEST (value)4.46315623505802
F-TEST (DF numerator)4
F-TEST (DF denominator)63
p-value0.00307270785024671
Multiple Linear Regression - Residual Statistics
Residual Standard Deviation0.188328387209927
Sum Squared Residuals2.23445763003281


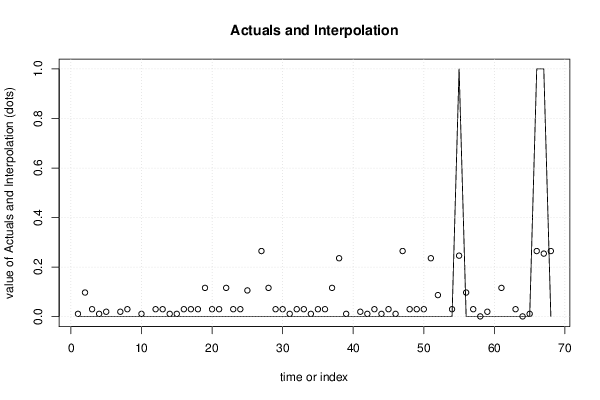
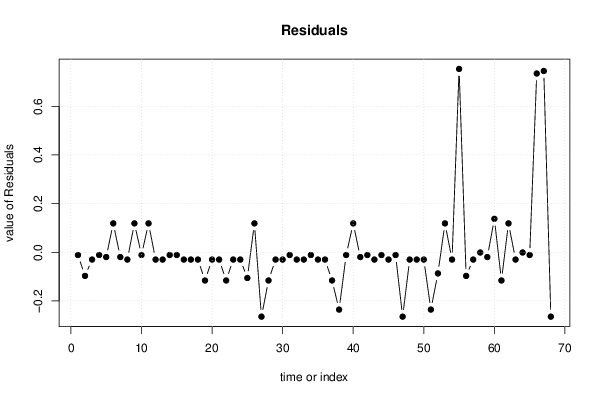
Multiple Linear Regression - Actuals, Interpolation, and Residuals
Time or IndexActualsInterpolationForecastResidualsPrediction Error
100.011319961722621-0.011319961722621
200.0973832791765152-0.0973832791765152
300.0300574681702059-0.0300574681702059
400.011319961722621-0.011319961722621
500.0197395957255769-0.0197395957255769
60-0.1186876624921630.118687662492163
700.0197395957255769-0.0197395957255769
800.0300574681702058-0.0300574681702058
90-0.1186876624921630.118687662492163
1000.011319961722621-0.011319961722621
110-0.1186876624921630.118687662492163
1200.0300574681702058-0.0300574681702058
1300.0300574681702058-0.0300574681702058
1400.011319961722621-0.011319961722621
1500.011319961722621-0.011319961722621
1600.0300574681702058-0.0300574681702058
1700.0300574681702058-0.0300574681702058
1800.0300574681702058-0.0300574681702058
1900.1161207856241-0.1161207856241
2000.0300574681702058-0.0300574681702058
2100.0300574681702058-0.0300574681702058
2200.1161207856241-0.1161207856241
2300.0300574681702058-0.0300574681702058
2400.0300574681702058-0.0300574681702058
2500.105802913179471-0.105802913179471
260-0.1186876624921630.118687662492163
2700.264865916286469-0.264865916286469
2800.1161207856241-0.1161207856241
2900.0300574681702058-0.0300574681702058
3000.0300574681702058-0.0300574681702058
3100.011319961722621-0.011319961722621
3200.0300574681702058-0.0300574681702058
3300.0300574681702058-0.0300574681702058
3400.011319961722621-0.011319961722621
3500.0300574681702058-0.0300574681702058
3600.0300574681702058-0.0300574681702058
3700.1161207856241-0.1161207856241
3800.235810537394255-0.235810537394255
3900.011319961722621-0.011319961722621
400-0.1186876624921630.118687662492163
4100.0197395957255769-0.0197395957255769
4200.011319961722621-0.011319961722621
4300.0300574681702058-0.0300574681702058
4400.011319961722621-0.011319961722621
4500.0300574681702058-0.0300574681702058
4600.011319961722621-0.011319961722621
4700.264865916286469-0.264865916286469
4800.0300574681702058-0.0300574681702058
4900.0300574681702058-0.0300574681702058
5000.0300574681702058-0.0300574681702058
5100.235810537394255-0.235810537394255
5200.0870654067318864-0.0870654067318864
530-0.1186876624921630.118687662492163
5400.0300574681702058-0.0300574681702058
5510.2461284098388840.753871590161116
5600.0973832791765153-0.0973832791765153
5700.0300574681702058-0.0300574681702058
5800.00100208927799206-0.00100208927799206
5900.0197395957255769-0.0197395957255769
600-0.1374251689397480.137425168939748
6100.1161207856241-0.1161207856241
620-0.1186876624921630.118687662492163
6300.0300574681702058-0.0300574681702058
6400.00100208927799206-0.00100208927799206
6500.011319961722621-0.011319961722621
6610.2648659162864690.735134083713531
6710.254548043841840.74545195615816
6800.264865916286469-0.264865916286469

\begin{tabular}{lllllllll}
\hline
Multiple Linear Regression - Actuals, Interpolation, and Residuals \tabularnewline
Time or Index & Actuals & InterpolationForecast & ResidualsPrediction Error \tabularnewline
1 & 0 & 0.011319961722621 & -0.011319961722621 \tabularnewline
2 & 0 & 0.0973832791765152 & -0.0973832791765152 \tabularnewline
3 & 0 & 0.0300574681702059 & -0.0300574681702059 \tabularnewline
4 & 0 & 0.011319961722621 & -0.011319961722621 \tabularnewline
5 & 0 & 0.0197395957255769 & -0.0197395957255769 \tabularnewline
6 & 0 & -0.118687662492163 & 0.118687662492163 \tabularnewline
7 & 0 & 0.0197395957255769 & -0.0197395957255769 \tabularnewline
8 & 0 & 0.0300574681702058 & -0.0300574681702058 \tabularnewline
9 & 0 & -0.118687662492163 & 0.118687662492163 \tabularnewline
10 & 0 & 0.011319961722621 & -0.011319961722621 \tabularnewline
11 & 0 & -0.118687662492163 & 0.118687662492163 \tabularnewline
12 & 0 & 0.0300574681702058 & -0.0300574681702058 \tabularnewline
13 & 0 & 0.0300574681702058 & -0.0300574681702058 \tabularnewline
14 & 0 & 0.011319961722621 & -0.011319961722621 \tabularnewline
15 & 0 & 0.011319961722621 & -0.011319961722621 \tabularnewline
16 & 0 & 0.0300574681702058 & -0.0300574681702058 \tabularnewline
17 & 0 & 0.0300574681702058 & -0.0300574681702058 \tabularnewline
18 & 0 & 0.0300574681702058 & -0.0300574681702058 \tabularnewline
19 & 0 & 0.1161207856241 & -0.1161207856241 \tabularnewline
20 & 0 & 0.0300574681702058 & -0.0300574681702058 \tabularnewline
21 & 0 & 0.0300574681702058 & -0.0300574681702058 \tabularnewline
22 & 0 & 0.1161207856241 & -0.1161207856241 \tabularnewline
23 & 0 & 0.0300574681702058 & -0.0300574681702058 \tabularnewline
24 & 0 & 0.0300574681702058 & -0.0300574681702058 \tabularnewline
25 & 0 & 0.105802913179471 & -0.105802913179471 \tabularnewline
26 & 0 & -0.118687662492163 & 0.118687662492163 \tabularnewline
27 & 0 & 0.264865916286469 & -0.264865916286469 \tabularnewline
28 & 0 & 0.1161207856241 & -0.1161207856241 \tabularnewline
29 & 0 & 0.0300574681702058 & -0.0300574681702058 \tabularnewline
30 & 0 & 0.0300574681702058 & -0.0300574681702058 \tabularnewline
31 & 0 & 0.011319961722621 & -0.011319961722621 \tabularnewline
32 & 0 & 0.0300574681702058 & -0.0300574681702058 \tabularnewline
33 & 0 & 0.0300574681702058 & -0.0300574681702058 \tabularnewline
34 & 0 & 0.011319961722621 & -0.011319961722621 \tabularnewline
35 & 0 & 0.0300574681702058 & -0.0300574681702058 \tabularnewline
36 & 0 & 0.0300574681702058 & -0.0300574681702058 \tabularnewline
37 & 0 & 0.1161207856241 & -0.1161207856241 \tabularnewline
38 & 0 & 0.235810537394255 & -0.235810537394255 \tabularnewline
39 & 0 & 0.011319961722621 & -0.011319961722621 \tabularnewline
40 & 0 & -0.118687662492163 & 0.118687662492163 \tabularnewline
41 & 0 & 0.0197395957255769 & -0.0197395957255769 \tabularnewline
42 & 0 & 0.011319961722621 & -0.011319961722621 \tabularnewline
43 & 0 & 0.0300574681702058 & -0.0300574681702058 \tabularnewline
44 & 0 & 0.011319961722621 & -0.011319961722621 \tabularnewline
45 & 0 & 0.0300574681702058 & -0.0300574681702058 \tabularnewline
46 & 0 & 0.011319961722621 & -0.011319961722621 \tabularnewline
47 & 0 & 0.264865916286469 & -0.264865916286469 \tabularnewline
48 & 0 & 0.0300574681702058 & -0.0300574681702058 \tabularnewline
49 & 0 & 0.0300574681702058 & -0.0300574681702058 \tabularnewline
50 & 0 & 0.0300574681702058 & -0.0300574681702058 \tabularnewline
51 & 0 & 0.235810537394255 & -0.235810537394255 \tabularnewline
52 & 0 & 0.0870654067318864 & -0.0870654067318864 \tabularnewline
53 & 0 & -0.118687662492163 & 0.118687662492163 \tabularnewline
54 & 0 & 0.0300574681702058 & -0.0300574681702058 \tabularnewline
55 & 1 & 0.246128409838884 & 0.753871590161116 \tabularnewline
56 & 0 & 0.0973832791765153 & -0.0973832791765153 \tabularnewline
57 & 0 & 0.0300574681702058 & -0.0300574681702058 \tabularnewline
58 & 0 & 0.00100208927799206 & -0.00100208927799206 \tabularnewline
59 & 0 & 0.0197395957255769 & -0.0197395957255769 \tabularnewline
60 & 0 & -0.137425168939748 & 0.137425168939748 \tabularnewline
61 & 0 & 0.1161207856241 & -0.1161207856241 \tabularnewline
62 & 0 & -0.118687662492163 & 0.118687662492163 \tabularnewline
63 & 0 & 0.0300574681702058 & -0.0300574681702058 \tabularnewline
64 & 0 & 0.00100208927799206 & -0.00100208927799206 \tabularnewline
65 & 0 & 0.011319961722621 & -0.011319961722621 \tabularnewline
66 & 1 & 0.264865916286469 & 0.735134083713531 \tabularnewline
67 & 1 & 0.25454804384184 & 0.74545195615816 \tabularnewline
68 & 0 & 0.264865916286469 & -0.264865916286469 \tabularnewline
\hline
\end{tabular}
%Source: https://freestatistics.org/blog/index.php?pk=202967&T=4

[TABLE]
[ROW][C]Multiple Linear Regression - Actuals, Interpolation, and Residuals[/C][/ROW]
[ROW][C]Time or Index[/C][C]Actuals[/C][C]InterpolationForecast[/C][C]ResidualsPrediction Error[/C][/ROW]
[ROW][C]1[/C][C]0[/C][C]0.011319961722621[/C][C]-0.011319961722621[/C][/ROW]
[ROW][C]2[/C][C]0[/C][C]0.0973832791765152[/C][C]-0.0973832791765152[/C][/ROW]
[ROW][C]3[/C][C]0[/C][C]0.0300574681702059[/C][C]-0.0300574681702059[/C][/ROW]
[ROW][C]4[/C][C]0[/C][C]0.011319961722621[/C][C]-0.011319961722621[/C][/ROW]
[ROW][C]5[/C][C]0[/C][C]0.0197395957255769[/C][C]-0.0197395957255769[/C][/ROW]
[ROW][C]6[/C][C]0[/C][C]-0.118687662492163[/C][C]0.118687662492163[/C][/ROW]
[ROW][C]7[/C][C]0[/C][C]0.0197395957255769[/C][C]-0.0197395957255769[/C][/ROW]
[ROW][C]8[/C][C]0[/C][C]0.0300574681702058[/C][C]-0.0300574681702058[/C][/ROW]
[ROW][C]9[/C][C]0[/C][C]-0.118687662492163[/C][C]0.118687662492163[/C][/ROW]
[ROW][C]10[/C][C]0[/C][C]0.011319961722621[/C][C]-0.011319961722621[/C][/ROW]
[ROW][C]11[/C][C]0[/C][C]-0.118687662492163[/C][C]0.118687662492163[/C][/ROW]
[ROW][C]12[/C][C]0[/C][C]0.0300574681702058[/C][C]-0.0300574681702058[/C][/ROW]
[ROW][C]13[/C][C]0[/C][C]0.0300574681702058[/C][C]-0.0300574681702058[/C][/ROW]
[ROW][C]14[/C][C]0[/C][C]0.011319961722621[/C][C]-0.011319961722621[/C][/ROW]
[ROW][C]15[/C][C]0[/C][C]0.011319961722621[/C][C]-0.011319961722621[/C][/ROW]
[ROW][C]16[/C][C]0[/C][C]0.0300574681702058[/C][C]-0.0300574681702058[/C][/ROW]
[ROW][C]17[/C][C]0[/C][C]0.0300574681702058[/C][C]-0.0300574681702058[/C][/ROW]
[ROW][C]18[/C][C]0[/C][C]0.0300574681702058[/C][C]-0.0300574681702058[/C][/ROW]
[ROW][C]19[/C][C]0[/C][C]0.1161207856241[/C][C]-0.1161207856241[/C][/ROW]
[ROW][C]20[/C][C]0[/C][C]0.0300574681702058[/C][C]-0.0300574681702058[/C][/ROW]
[ROW][C]21[/C][C]0[/C][C]0.0300574681702058[/C][C]-0.0300574681702058[/C][/ROW]
[ROW][C]22[/C][C]0[/C][C]0.1161207856241[/C][C]-0.1161207856241[/C][/ROW]
[ROW][C]23[/C][C]0[/C][C]0.0300574681702058[/C][C]-0.0300574681702058[/C][/ROW]
[ROW][C]24[/C][C]0[/C][C]0.0300574681702058[/C][C]-0.0300574681702058[/C][/ROW]
[ROW][C]25[/C][C]0[/C][C]0.105802913179471[/C][C]-0.105802913179471[/C][/ROW]
[ROW][C]26[/C][C]0[/C][C]-0.118687662492163[/C][C]0.118687662492163[/C][/ROW]
[ROW][C]27[/C][C]0[/C][C]0.264865916286469[/C][C]-0.264865916286469[/C][/ROW]
[ROW][C]28[/C][C]0[/C][C]0.1161207856241[/C][C]-0.1161207856241[/C][/ROW]
[ROW][C]29[/C][C]0[/C][C]0.0300574681702058[/C][C]-0.0300574681702058[/C][/ROW]
[ROW][C]30[/C][C]0[/C][C]0.0300574681702058[/C][C]-0.0300574681702058[/C][/ROW]
[ROW][C]31[/C][C]0[/C][C]0.011319961722621[/C][C]-0.011319961722621[/C][/ROW]
[ROW][C]32[/C][C]0[/C][C]0.0300574681702058[/C][C]-0.0300574681702058[/C][/ROW]
[ROW][C]33[/C][C]0[/C][C]0.0300574681702058[/C][C]-0.0300574681702058[/C][/ROW]
[ROW][C]34[/C][C]0[/C][C]0.011319961722621[/C][C]-0.011319961722621[/C][/ROW]
[ROW][C]35[/C][C]0[/C][C]0.0300574681702058[/C][C]-0.0300574681702058[/C][/ROW]
[ROW][C]36[/C][C]0[/C][C]0.0300574681702058[/C][C]-0.0300574681702058[/C][/ROW]
[ROW][C]37[/C][C]0[/C][C]0.1161207856241[/C][C]-0.1161207856241[/C][/ROW]
[ROW][C]38[/C][C]0[/C][C]0.235810537394255[/C][C]-0.235810537394255[/C][/ROW]
[ROW][C]39[/C][C]0[/C][C]0.011319961722621[/C][C]-0.011319961722621[/C][/ROW]
[ROW][C]40[/C][C]0[/C][C]-0.118687662492163[/C][C]0.118687662492163[/C][/ROW]
[ROW][C]41[/C][C]0[/C][C]0.0197395957255769[/C][C]-0.0197395957255769[/C][/ROW]
[ROW][C]42[/C][C]0[/C][C]0.011319961722621[/C][C]-0.011319961722621[/C][/ROW]
[ROW][C]43[/C][C]0[/C][C]0.0300574681702058[/C][C]-0.0300574681702058[/C][/ROW]
[ROW][C]44[/C][C]0[/C][C]0.011319961722621[/C][C]-0.011319961722621[/C][/ROW]
[ROW][C]45[/C][C]0[/C][C]0.0300574681702058[/C][C]-0.0300574681702058[/C][/ROW]
[ROW][C]46[/C][C]0[/C][C]0.011319961722621[/C][C]-0.011319961722621[/C][/ROW]
[ROW][C]47[/C][C]0[/C][C]0.264865916286469[/C][C]-0.264865916286469[/C][/ROW]
[ROW][C]48[/C][C]0[/C][C]0.0300574681702058[/C][C]-0.0300574681702058[/C][/ROW]
[ROW][C]49[/C][C]0[/C][C]0.0300574681702058[/C][C]-0.0300574681702058[/C][/ROW]
[ROW][C]50[/C][C]0[/C][C]0.0300574681702058[/C][C]-0.0300574681702058[/C][/ROW]
[ROW][C]51[/C][C]0[/C][C]0.235810537394255[/C][C]-0.235810537394255[/C][/ROW]
[ROW][C]52[/C][C]0[/C][C]0.0870654067318864[/C][C]-0.0870654067318864[/C][/ROW]
[ROW][C]53[/C][C]0[/C][C]-0.118687662492163[/C][C]0.118687662492163[/C][/ROW]
[ROW][C]54[/C][C]0[/C][C]0.0300574681702058[/C][C]-0.0300574681702058[/C][/ROW]
[ROW][C]55[/C][C]1[/C][C]0.246128409838884[/C][C]0.753871590161116[/C][/ROW]
[ROW][C]56[/C][C]0[/C][C]0.0973832791765153[/C][C]-0.0973832791765153[/C][/ROW]
[ROW][C]57[/C][C]0[/C][C]0.0300574681702058[/C][C]-0.0300574681702058[/C][/ROW]
[ROW][C]58[/C][C]0[/C][C]0.00100208927799206[/C][C]-0.00100208927799206[/C][/ROW]
[ROW][C]59[/C][C]0[/C][C]0.0197395957255769[/C][C]-0.0197395957255769[/C][/ROW]
[ROW][C]60[/C][C]0[/C][C]-0.137425168939748[/C][C]0.137425168939748[/C][/ROW]
[ROW][C]61[/C][C]0[/C][C]0.1161207856241[/C][C]-0.1161207856241[/C][/ROW]
[ROW][C]62[/C][C]0[/C][C]-0.118687662492163[/C][C]0.118687662492163[/C][/ROW]
[ROW][C]63[/C][C]0[/C][C]0.0300574681702058[/C][C]-0.0300574681702058[/C][/ROW]
[ROW][C]64[/C][C]0[/C][C]0.00100208927799206[/C][C]-0.00100208927799206[/C][/ROW]
[ROW][C]65[/C][C]0[/C][C]0.011319961722621[/C][C]-0.011319961722621[/C][/ROW]
[ROW][C]66[/C][C]1[/C][C]0.264865916286469[/C][C]0.735134083713531[/C][/ROW]
[ROW][C]67[/C][C]1[/C][C]0.25454804384184[/C][C]0.74545195615816[/C][/ROW]
[ROW][C]68[/C][C]0[/C][C]0.264865916286469[/C][C]-0.264865916286469[/C][/ROW]
[/TABLE]
Source: https://freestatistics.org/blog/index.php?pk=202967&T=4

Globally Unique Identifier (entire table): ba.freestatistics.org/blog/index.php?pk=202967&T=4

As an alternative you can also use a QR Code:  

The GUIDs for individual cells are displayed in the table below:

Multiple Linear Regression - Actuals, Interpolation, and Residuals
Time or IndexActualsInterpolationForecastResidualsPrediction Error
100.011319961722621-0.011319961722621
200.0973832791765152-0.0973832791765152
300.0300574681702059-0.0300574681702059
400.011319961722621-0.011319961722621
500.0197395957255769-0.0197395957255769
60-0.1186876624921630.118687662492163
700.0197395957255769-0.0197395957255769
800.0300574681702058-0.0300574681702058
90-0.1186876624921630.118687662492163
1000.011319961722621-0.011319961722621
110-0.1186876624921630.118687662492163
1200.0300574681702058-0.0300574681702058
1300.0300574681702058-0.0300574681702058
1400.011319961722621-0.011319961722621
1500.011319961722621-0.011319961722621
1600.0300574681702058-0.0300574681702058
1700.0300574681702058-0.0300574681702058
1800.0300574681702058-0.0300574681702058
1900.1161207856241-0.1161207856241
2000.0300574681702058-0.0300574681702058
2100.0300574681702058-0.0300574681702058
2200.1161207856241-0.1161207856241
2300.0300574681702058-0.0300574681702058
2400.0300574681702058-0.0300574681702058
2500.105802913179471-0.105802913179471
260-0.1186876624921630.118687662492163
2700.264865916286469-0.264865916286469
2800.1161207856241-0.1161207856241
2900.0300574681702058-0.0300574681702058
3000.0300574681702058-0.0300574681702058
3100.011319961722621-0.011319961722621
3200.0300574681702058-0.0300574681702058
3300.0300574681702058-0.0300574681702058
3400.011319961722621-0.011319961722621
3500.0300574681702058-0.0300574681702058
3600.0300574681702058-0.0300574681702058
3700.1161207856241-0.1161207856241
3800.235810537394255-0.235810537394255
3900.011319961722621-0.011319961722621
400-0.1186876624921630.118687662492163
4100.0197395957255769-0.0197395957255769
4200.011319961722621-0.011319961722621
4300.0300574681702058-0.0300574681702058
4400.011319961722621-0.011319961722621
4500.0300574681702058-0.0300574681702058
4600.011319961722621-0.011319961722621
4700.264865916286469-0.264865916286469
4800.0300574681702058-0.0300574681702058
4900.0300574681702058-0.0300574681702058
5000.0300574681702058-0.0300574681702058
5100.235810537394255-0.235810537394255
5200.0870654067318864-0.0870654067318864
530-0.1186876624921630.118687662492163
5400.0300574681702058-0.0300574681702058
5510.2461284098388840.753871590161116
5600.0973832791765153-0.0973832791765153
5700.0300574681702058-0.0300574681702058
5800.00100208927799206-0.00100208927799206
5900.0197395957255769-0.0197395957255769
600-0.1374251689397480.137425168939748
6100.1161207856241-0.1161207856241
620-0.1186876624921630.118687662492163
6300.0300574681702058-0.0300574681702058
6400.00100208927799206-0.00100208927799206
6500.011319961722621-0.011319961722621
6610.2648659162864690.735134083713531
6710.254548043841840.74545195615816
6800.264865916286469-0.264865916286469


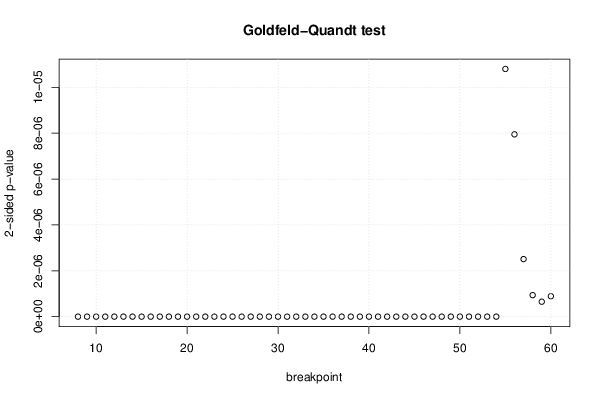
Goldfeld-Quandt test for Heteroskedasticity
p-valuesAlternative Hypothesis
breakpoint indexgreater2-sidedless
8001
9001
10001
11001
12001
13001
14001
15001
16001
17001
18001
19001
20001
21001
22001
23001
24001
25001
26001
27001
28001
29001
30001
31001
32001
33001
34001
35001
36001
37001
38001
39001
40001
41001
42001
43001
44001
45001
46001
47001
48001
49001
50001
51001
52001
53001
54001
555.40200243821196e-061.08040048764239e-050.999994597997562
563.97614093053672e-067.95228186107343e-060.999996023859069
571.25513987686147e-062.51027975372294e-060.999998744860123
584.6898927698096e-079.3797855396192e-070.999999531010723
593.2576287135194e-076.51525742703881e-070.999999674237129
604.45186410542743e-078.90372821085486e-070.999999554813589

\begin{tabular}{lllllllll}
\hline
Goldfeld-Quandt test for Heteroskedasticity \tabularnewline
p-values & Alternative Hypothesis \tabularnewline
breakpoint index & greater & 2-sided & less \tabularnewline
8 & 0 & 0 & 1 \tabularnewline
9 & 0 & 0 & 1 \tabularnewline
10 & 0 & 0 & 1 \tabularnewline
11 & 0 & 0 & 1 \tabularnewline
12 & 0 & 0 & 1 \tabularnewline
13 & 0 & 0 & 1 \tabularnewline
14 & 0 & 0 & 1 \tabularnewline
15 & 0 & 0 & 1 \tabularnewline
16 & 0 & 0 & 1 \tabularnewline
17 & 0 & 0 & 1 \tabularnewline
18 & 0 & 0 & 1 \tabularnewline
19 & 0 & 0 & 1 \tabularnewline
20 & 0 & 0 & 1 \tabularnewline
21 & 0 & 0 & 1 \tabularnewline
22 & 0 & 0 & 1 \tabularnewline
23 & 0 & 0 & 1 \tabularnewline
24 & 0 & 0 & 1 \tabularnewline
25 & 0 & 0 & 1 \tabularnewline
26 & 0 & 0 & 1 \tabularnewline
27 & 0 & 0 & 1 \tabularnewline
28 & 0 & 0 & 1 \tabularnewline
29 & 0 & 0 & 1 \tabularnewline
30 & 0 & 0 & 1 \tabularnewline
31 & 0 & 0 & 1 \tabularnewline
32 & 0 & 0 & 1 \tabularnewline
33 & 0 & 0 & 1 \tabularnewline
34 & 0 & 0 & 1 \tabularnewline
35 & 0 & 0 & 1 \tabularnewline
36 & 0 & 0 & 1 \tabularnewline
37 & 0 & 0 & 1 \tabularnewline
38 & 0 & 0 & 1 \tabularnewline
39 & 0 & 0 & 1 \tabularnewline
40 & 0 & 0 & 1 \tabularnewline
41 & 0 & 0 & 1 \tabularnewline
42 & 0 & 0 & 1 \tabularnewline
43 & 0 & 0 & 1 \tabularnewline
44 & 0 & 0 & 1 \tabularnewline
45 & 0 & 0 & 1 \tabularnewline
46 & 0 & 0 & 1 \tabularnewline
47 & 0 & 0 & 1 \tabularnewline
48 & 0 & 0 & 1 \tabularnewline
49 & 0 & 0 & 1 \tabularnewline
50 & 0 & 0 & 1 \tabularnewline
51 & 0 & 0 & 1 \tabularnewline
52 & 0 & 0 & 1 \tabularnewline
53 & 0 & 0 & 1 \tabularnewline
54 & 0 & 0 & 1 \tabularnewline
55 & 5.40200243821196e-06 & 1.08040048764239e-05 & 0.999994597997562 \tabularnewline
56 & 3.97614093053672e-06 & 7.95228186107343e-06 & 0.999996023859069 \tabularnewline
57 & 1.25513987686147e-06 & 2.51027975372294e-06 & 0.999998744860123 \tabularnewline
58 & 4.6898927698096e-07 & 9.3797855396192e-07 & 0.999999531010723 \tabularnewline
59 & 3.2576287135194e-07 & 6.51525742703881e-07 & 0.999999674237129 \tabularnewline
60 & 4.45186410542743e-07 & 8.90372821085486e-07 & 0.999999554813589 \tabularnewline
\hline
\end{tabular}
%Source: https://freestatistics.org/blog/index.php?pk=202967&T=5

[TABLE]
[ROW][C]Goldfeld-Quandt test for Heteroskedasticity[/C][/ROW]
[ROW][C]p-values[/C][C]Alternative Hypothesis[/C][/ROW]
[ROW][C]breakpoint index[/C][C]greater[/C][C]2-sided[/C][C]less[/C][/ROW]
[ROW][C]8[/C][C]0[/C][C]0[/C][C]1[/C][/ROW]
[ROW][C]9[/C][C]0[/C][C]0[/C][C]1[/C][/ROW]
[ROW][C]10[/C][C]0[/C][C]0[/C][C]1[/C][/ROW]
[ROW][C]11[/C][C]0[/C][C]0[/C][C]1[/C][/ROW]
[ROW][C]12[/C][C]0[/C][C]0[/C][C]1[/C][/ROW]
[ROW][C]13[/C][C]0[/C][C]0[/C][C]1[/C][/ROW]
[ROW][C]14[/C][C]0[/C][C]0[/C][C]1[/C][/ROW]
[ROW][C]15[/C][C]0[/C][C]0[/C][C]1[/C][/ROW]
[ROW][C]16[/C][C]0[/C][C]0[/C][C]1[/C][/ROW]
[ROW][C]17[/C][C]0[/C][C]0[/C][C]1[/C][/ROW]
[ROW][C]18[/C][C]0[/C][C]0[/C][C]1[/C][/ROW]
[ROW][C]19[/C][C]0[/C][C]0[/C][C]1[/C][/ROW]
[ROW][C]20[/C][C]0[/C][C]0[/C][C]1[/C][/ROW]
[ROW][C]21[/C][C]0[/C][C]0[/C][C]1[/C][/ROW]
[ROW][C]22[/C][C]0[/C][C]0[/C][C]1[/C][/ROW]
[ROW][C]23[/C][C]0[/C][C]0[/C][C]1[/C][/ROW]
[ROW][C]24[/C][C]0[/C][C]0[/C][C]1[/C][/ROW]
[ROW][C]25[/C][C]0[/C][C]0[/C][C]1[/C][/ROW]
[ROW][C]26[/C][C]0[/C][C]0[/C][C]1[/C][/ROW]
[ROW][C]27[/C][C]0[/C][C]0[/C][C]1[/C][/ROW]
[ROW][C]28[/C][C]0[/C][C]0[/C][C]1[/C][/ROW]
[ROW][C]29[/C][C]0[/C][C]0[/C][C]1[/C][/ROW]
[ROW][C]30[/C][C]0[/C][C]0[/C][C]1[/C][/ROW]
[ROW][C]31[/C][C]0[/C][C]0[/C][C]1[/C][/ROW]
[ROW][C]32[/C][C]0[/C][C]0[/C][C]1[/C][/ROW]
[ROW][C]33[/C][C]0[/C][C]0[/C][C]1[/C][/ROW]
[ROW][C]34[/C][C]0[/C][C]0[/C][C]1[/C][/ROW]
[ROW][C]35[/C][C]0[/C][C]0[/C][C]1[/C][/ROW]
[ROW][C]36[/C][C]0[/C][C]0[/C][C]1[/C][/ROW]
[ROW][C]37[/C][C]0[/C][C]0[/C][C]1[/C][/ROW]
[ROW][C]38[/C][C]0[/C][C]0[/C][C]1[/C][/ROW]
[ROW][C]39[/C][C]0[/C][C]0[/C][C]1[/C][/ROW]
[ROW][C]40[/C][C]0[/C][C]0[/C][C]1[/C][/ROW]
[ROW][C]41[/C][C]0[/C][C]0[/C][C]1[/C][/ROW]
[ROW][C]42[/C][C]0[/C][C]0[/C][C]1[/C][/ROW]
[ROW][C]43[/C][C]0[/C][C]0[/C][C]1[/C][/ROW]
[ROW][C]44[/C][C]0[/C][C]0[/C][C]1[/C][/ROW]
[ROW][C]45[/C][C]0[/C][C]0[/C][C]1[/C][/ROW]
[ROW][C]46[/C][C]0[/C][C]0[/C][C]1[/C][/ROW]
[ROW][C]47[/C][C]0[/C][C]0[/C][C]1[/C][/ROW]
[ROW][C]48[/C][C]0[/C][C]0[/C][C]1[/C][/ROW]
[ROW][C]49[/C][C]0[/C][C]0[/C][C]1[/C][/ROW]
[ROW][C]50[/C][C]0[/C][C]0[/C][C]1[/C][/ROW]
[ROW][C]51[/C][C]0[/C][C]0[/C][C]1[/C][/ROW]
[ROW][C]52[/C][C]0[/C][C]0[/C][C]1[/C][/ROW]
[ROW][C]53[/C][C]0[/C][C]0[/C][C]1[/C][/ROW]
[ROW][C]54[/C][C]0[/C][C]0[/C][C]1[/C][/ROW]
[ROW][C]55[/C][C]5.40200243821196e-06[/C][C]1.08040048764239e-05[/C][C]0.999994597997562[/C][/ROW]
[ROW][C]56[/C][C]3.97614093053672e-06[/C][C]7.95228186107343e-06[/C][C]0.999996023859069[/C][/ROW]
[ROW][C]57[/C][C]1.25513987686147e-06[/C][C]2.51027975372294e-06[/C][C]0.999998744860123[/C][/ROW]
[ROW][C]58[/C][C]4.6898927698096e-07[/C][C]9.3797855396192e-07[/C][C]0.999999531010723[/C][/ROW]
[ROW][C]59[/C][C]3.2576287135194e-07[/C][C]6.51525742703881e-07[/C][C]0.999999674237129[/C][/ROW]
[ROW][C]60[/C][C]4.45186410542743e-07[/C][C]8.90372821085486e-07[/C][C]0.999999554813589[/C][/ROW]
[/TABLE]
Source: https://freestatistics.org/blog/index.php?pk=202967&T=5

Globally Unique Identifier (entire table): ba.freestatistics.org/blog/index.php?pk=202967&T=5

As an alternative you can also use a QR Code:  

The GUIDs for individual cells are displayed in the table below:

Goldfeld-Quandt test for Heteroskedasticity
p-valuesAlternative Hypothesis
breakpoint indexgreater2-sidedless
8001
9001
10001
11001
12001
13001
14001
15001
16001
17001
18001
19001
20001
21001
22001
23001
24001
25001
26001
27001
28001
29001
30001
31001
32001
33001
34001
35001
36001
37001
38001
39001
40001
41001
42001
43001
44001
45001
46001
47001
48001
49001
50001
51001
52001
53001
54001
555.40200243821196e-061.08040048764239e-050.999994597997562
563.97614093053672e-067.95228186107343e-060.999996023859069
571.25513987686147e-062.51027975372294e-060.999998744860123
584.6898927698096e-079.3797855396192e-070.999999531010723
593.2576287135194e-076.51525742703881e-070.999999674237129
604.45186410542743e-078.90372821085486e-070.999999554813589


Meta Analysis of Goldfeld-Quandt test for Heteroskedasticity
Description# significant tests% significant testsOK/NOK
1% type I error level531NOK
5% type I error level531NOK
10% type I error level531NOK

\begin{tabular}{lllllllll}
\hline
Meta Analysis of Goldfeld-Quandt test for Heteroskedasticity \tabularnewline
Description & # significant tests & % significant tests & OK/NOK \tabularnewline
1% type I error level & 53 & 1 & NOK \tabularnewline
5% type I error level & 53 & 1 & NOK \tabularnewline
10% type I error level & 53 & 1 & NOK \tabularnewline
\hline
\end{tabular}
%Source: https://freestatistics.org/blog/index.php?pk=202967&T=6

[TABLE]
[ROW][C]Meta Analysis of Goldfeld-Quandt test for Heteroskedasticity[/C][/ROW]
[ROW][C]Description[/C][C]# significant tests[/C][C]% significant tests[/C][C]OK/NOK[/C][/ROW]
[ROW][C]1% type I error level[/C][C]53[/C][C]1[/C][C]NOK[/C][/ROW]
[ROW][C]5% type I error level[/C][C]53[/C][C]1[/C][C]NOK[/C][/ROW]
[ROW][C]10% type I error level[/C][C]53[/C][C]1[/C][C]NOK[/C][/ROW]
[/TABLE]
Source: https://freestatistics.org/blog/index.php?pk=202967&T=6

Globally Unique Identifier (entire table): ba.freestatistics.org/blog/index.php?pk=202967&T=6

As an alternative you can also use a QR Code:  

The GUIDs for individual cells are displayed in the table below:

Meta Analysis of Goldfeld-Quandt test for Heteroskedasticity
Description# significant tests% significant testsOK/NOK
1% type I error level531NOK
5% type I error level531NOK
10% type I error level531NOK


Parameters (Session):
par1 = 3 ; par2 = Do not include Seasonal Dummies ; par3 = No Linear Trend ;
Parameters (R input):
par1 = 3 ; par2 = Do not include Seasonal Dummies ; par3 = No Linear Trend ;
R code (references can be found in the software module):
library(lattice)
library(lmtest)
n25 <- 25 #minimum number of obs. for Goldfeld-Quandt test
par1 <- as.numeric(par1)
x <- t(y)
k <- length(x[1,])
n <- length(x[,1])
x1 <- cbind(x[,par1], x[,1:k!=par1])
mycolnames <- c(colnames(x)[par1], colnames(x)[1:k!=par1])
colnames(x1) <- mycolnames #colnames(x)[par1]
x <- x1
if (par3 == 'First Differences'){
x2 <- array(0, dim=c(n-1,k), dimnames=list(1:(n-1), paste('(1-B)',colnames(x),sep='')))
for (i in 1:n-1) {
for (j in 1:k) {
x2[i,j] <- x[i+1,j] - x[i,j]
}
}
x <- x2
}
if (par2 == 'Include Monthly Dummies'){
x2 <- array(0, dim=c(n,11), dimnames=list(1:n, paste('M', seq(1:11), sep ='')))
for (i in 1:11){
x2[seq(i,n,12),i] <- 1
}
x <- cbind(x, x2)
}
if (par2 == 'Include Quarterly Dummies'){
x2 <- array(0, dim=c(n,3), dimnames=list(1:n, paste('Q', seq(1:3), sep ='')))
for (i in 1:3){
x2[seq(i,n,4),i] <- 1
}
x <- cbind(x, x2)
}
k <- length(x[1,])
if (par3 == 'Linear Trend'){
x <- cbind(x, c(1:n))
colnames(x)[k+1] <- 't'
}
x
k <- length(x[1,])
df <- as.data.frame(x)
(mylm <- lm(df))
(mysum <- summary(mylm))
if (n > n25) {
kp3 <- k + 3
nmkm3 <- n - k - 3
gqarr <- array(NA, dim=c(nmkm3-kp3+1,3))
numgqtests <- 0
numsignificant1 <- 0
numsignificant5 <- 0
numsignificant10 <- 0
for (mypoint in kp3:nmkm3) {
j <- 0
numgqtests <- numgqtests + 1
for (myalt in c('greater', 'two.sided', 'less')) {
j <- j + 1
gqarr[mypoint-kp3+1,j] <- gqtest(mylm, point=mypoint, alternative=myalt)$p.value
}
if (gqarr[mypoint-kp3+1,2] < 0.01) numsignificant1 <- numsignificant1 + 1
if (gqarr[mypoint-kp3+1,2] < 0.05) numsignificant5 <- numsignificant5 + 1
if (gqarr[mypoint-kp3+1,2] < 0.10) numsignificant10 <- numsignificant10 + 1
}
gqarr
}
bitmap(file='test0.png')
plot(x[,1], type='l', main='Actuals and Interpolation', ylab='value of Actuals and Interpolation (dots)', xlab='time or index')
points(x[,1]-mysum$resid)
grid()
dev.off()
bitmap(file='test1.png')
plot(mysum$resid, type='b', pch=19, main='Residuals', ylab='value of Residuals', xlab='time or index')
grid()
dev.off()
bitmap(file='test2.png')
hist(mysum$resid, main='Residual Histogram', xlab='values of Residuals')
grid()
dev.off()
bitmap(file='test3.png')
densityplot(~mysum$resid,col='black',main='Residual Density Plot', xlab='values of Residuals')
dev.off()
bitmap(file='test4.png')
qqnorm(mysum$resid, main='Residual Normal Q-Q Plot')
qqline(mysum$resid)
grid()
dev.off()
(myerror <- as.ts(mysum$resid))
bitmap(file='test5.png')
dum <- cbind(lag(myerror,k=1),myerror)
dum
dum1 <- dum[2:length(myerror),]
dum1
z <- as.data.frame(dum1)
z
plot(z,main=paste('Residual Lag plot, lowess, and regression line'), ylab='values of Residuals', xlab='lagged values of Residuals')
lines(lowess(z))
abline(lm(z))
grid()
dev.off()
bitmap(file='test6.png')
acf(mysum$resid, lag.max=length(mysum$resid)/2, main='Residual Autocorrelation Function')
grid()
dev.off()
bitmap(file='test7.png')
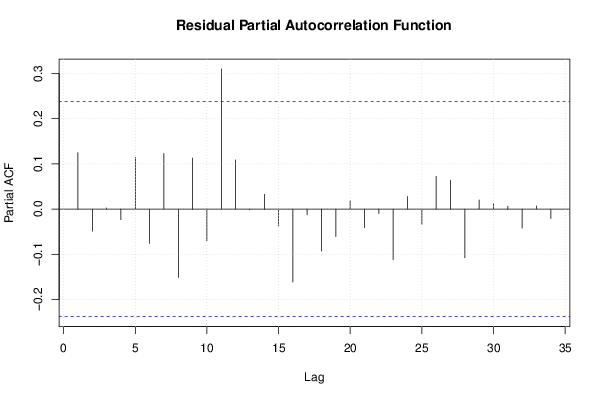
pacf(mysum$resid, lag.max=length(mysum$resid)/2, main='Residual Partial Autocorrelation Function')
grid()
dev.off()
bitmap(file='test8.png')
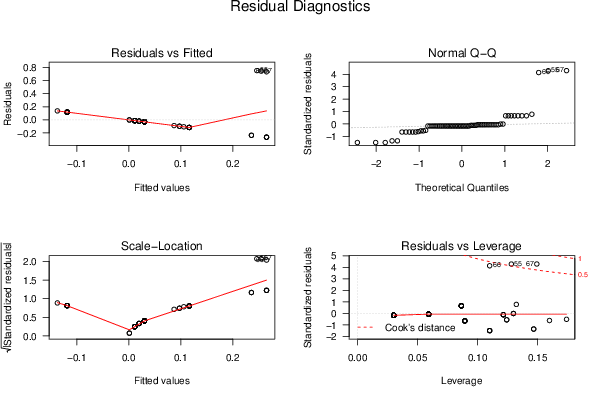
opar <- par(mfrow = c(2,2), oma = c(0, 0, 1.1, 0))
plot(mylm, las = 1, sub='Residual Diagnostics')
par(opar)
dev.off()
if (n > n25) {
bitmap(file='test9.png')
plot(kp3:nmkm3,gqarr[,2], main='Goldfeld-Quandt test',ylab='2-sided p-value',xlab='breakpoint')
grid()
dev.off()
}
load(file='createtable')
a<-table.start()
a<-table.row.start(a)
a<-table.element(a, 'Multiple Linear Regression - Estimated Regression Equation', 1, TRUE)
a<-table.row.end(a)
myeq <- colnames(x)[1]
myeq <- paste(myeq, '[t] = ', sep='')
for (i in 1:k){
if (mysum$coefficients[i,1] > 0) myeq <- paste(myeq, '+', '')
myeq <- paste(myeq, mysum$coefficients[i,1], sep=' ')
if (rownames(mysum$coefficients)[i] != '(Intercept)') {
myeq <- paste(myeq, rownames(mysum$coefficients)[i], sep='')
if (rownames(mysum$coefficients)[i] != 't') myeq <- paste(myeq, '[t]', sep='')
}
}
myeq <- paste(myeq, ' + e[t]')
a<-table.row.start(a)
a<-table.element(a, myeq)
a<-table.row.end(a)
a<-table.end(a)
table.save(a,file='mytable1.tab')
a<-table.start()
a<-table.row.start(a)
a<-table.element(a,hyperlink('ols1.htm','Multiple Linear Regression - Ordinary Least Squares',''), 6, TRUE)
a<-table.row.end(a)
a<-table.row.start(a)
a<-table.element(a,'Variable',header=TRUE)
a<-table.element(a,'Parameter',header=TRUE)
a<-table.element(a,'S.D.',header=TRUE)
a<-table.element(a,'T-STAT
H0: parameter = 0',header=TRUE)
a<-table.element(a,'2-tail p-value',header=TRUE)
a<-table.element(a,'1-tail p-value',header=TRUE)
a<-table.row.end(a)
for (i in 1:k){
a<-table.row.start(a)
a<-table.element(a,rownames(mysum$coefficients)[i],header=TRUE)
a<-table.element(a,mysum$coefficients[i,1])
a<-table.element(a, round(mysum$coefficients[i,2],6))
a<-table.element(a, round(mysum$coefficients[i,3],4))
a<-table.element(a, round(mysum$coefficients[i,4],6))
a<-table.element(a, round(mysum$coefficients[i,4]/2,6))
a<-table.row.end(a)
}
a<-table.end(a)
table.save(a,file='mytable2.tab')
a<-table.start()
a<-table.row.start(a)
a<-table.element(a, 'Multiple Linear Regression - Regression Statistics', 2, TRUE)
a<-table.row.end(a)
a<-table.row.start(a)
a<-table.element(a, 'Multiple R',1,TRUE)
a<-table.element(a, sqrt(mysum$r.squared))
a<-table.row.end(a)
a<-table.row.start(a)
a<-table.element(a, 'R-squared',1,TRUE)
a<-table.element(a, mysum$r.squared)
a<-table.row.end(a)
a<-table.row.start(a)
a<-table.element(a, 'Adjusted R-squared',1,TRUE)
a<-table.element(a, mysum$adj.r.squared)
a<-table.row.end(a)
a<-table.row.start(a)
a<-table.element(a, 'F-TEST (value)',1,TRUE)
a<-table.element(a, mysum$fstatistic[1])
a<-table.row.end(a)
a<-table.row.start(a)
a<-table.element(a, 'F-TEST (DF numerator)',1,TRUE)
a<-table.element(a, mysum$fstatistic[2])
a<-table.row.end(a)
a<-table.row.start(a)
a<-table.element(a, 'F-TEST (DF denominator)',1,TRUE)
a<-table.element(a, mysum$fstatistic[3])
a<-table.row.end(a)
a<-table.row.start(a)
a<-table.element(a, 'p-value',1,TRUE)
a<-table.element(a, 1-pf(mysum$fstatistic[1],mysum$fstatistic[2],mysum$fstatistic[3]))
a<-table.row.end(a)
a<-table.row.start(a)
a<-table.element(a, 'Multiple Linear Regression - Residual Statistics', 2, TRUE)
a<-table.row.end(a)
a<-table.row.start(a)
a<-table.element(a, 'Residual Standard Deviation',1,TRUE)
a<-table.element(a, mysum$sigma)
a<-table.row.end(a)
a<-table.row.start(a)
a<-table.element(a, 'Sum Squared Residuals',1,TRUE)
a<-table.element(a, sum(myerror*myerror))
a<-table.row.end(a)
a<-table.end(a)
table.save(a,file='mytable3.tab')
a<-table.start()
a<-table.row.start(a)
a<-table.element(a, 'Multiple Linear Regression - Actuals, Interpolation, and Residuals', 4, TRUE)
a<-table.row.end(a)
a<-table.row.start(a)
a<-table.element(a, 'Time or Index', 1, TRUE)
a<-table.element(a, 'Actuals', 1, TRUE)
a<-table.element(a, 'Interpolation
Forecast', 1, TRUE)
a<-table.element(a, 'Residuals
Prediction Error', 1, TRUE)
a<-table.row.end(a)
for (i in 1:n) {
a<-table.row.start(a)
a<-table.element(a,i, 1, TRUE)
a<-table.element(a,x[i])
a<-table.element(a,x[i]-mysum$resid[i])
a<-table.element(a,mysum$resid[i])
a<-table.row.end(a)
}
a<-table.end(a)
table.save(a,file='mytable4.tab')
if (n > n25) {
a<-table.start()
a<-table.row.start(a)
a<-table.element(a,'Goldfeld-Quandt test for Heteroskedasticity',4,TRUE)
a<-table.row.end(a)
a<-table.row.start(a)
a<-table.element(a,'p-values',header=TRUE)
a<-table.element(a,'Alternative Hypothesis',3,header=TRUE)
a<-table.row.end(a)
a<-table.row.start(a)
a<-table.element(a,'breakpoint index',header=TRUE)
a<-table.element(a,'greater',header=TRUE)
a<-table.element(a,'2-sided',header=TRUE)
a<-table.element(a,'less',header=TRUE)
a<-table.row.end(a)
for (mypoint in kp3:nmkm3) {
a<-table.row.start(a)
a<-table.element(a,mypoint,header=TRUE)
a<-table.element(a,gqarr[mypoint-kp3+1,1])
a<-table.element(a,gqarr[mypoint-kp3+1,2])
a<-table.element(a,gqarr[mypoint-kp3+1,3])
a<-table.row.end(a)
}
a<-table.end(a)
table.save(a,file='mytable5.tab')
a<-table.start()
a<-table.row.start(a)
a<-table.element(a,'Meta Analysis of Goldfeld-Quandt test for Heteroskedasticity',4,TRUE)
a<-table.row.end(a)
a<-table.row.start(a)
a<-table.element(a,'Description',header=TRUE)
a<-table.element(a,'# significant tests',header=TRUE)
a<-table.element(a,'% significant tests',header=TRUE)
a<-table.element(a,'OK/NOK',header=TRUE)
a<-table.row.end(a)
a<-table.row.start(a)
a<-table.element(a,'1% type I error level',header=TRUE)
a<-table.element(a,numsignificant1)
a<-table.element(a,numsignificant1/numgqtests)
if (numsignificant1/numgqtests < 0.01) dum <- 'OK' else dum <- 'NOK'
a<-table.element(a,dum)
a<-table.row.end(a)
a<-table.row.start(a)
a<-table.element(a,'5% type I error level',header=TRUE)
a<-table.element(a,numsignificant5)
a<-table.element(a,numsignificant5/numgqtests)
if (numsignificant5/numgqtests < 0.05) dum <- 'OK' else dum <- 'NOK'
a<-table.element(a,dum)
a<-table.row.end(a)
a<-table.row.start(a)
a<-table.element(a,'10% type I error level',header=TRUE)
a<-table.element(a,numsignificant10)
a<-table.element(a,numsignificant10/numgqtests)
if (numsignificant10/numgqtests < 0.1) dum <- 'OK' else dum <- 'NOK'
a<-table.element(a,dum)
a<-table.row.end(a)
a<-table.end(a)
table.save(a,file='mytable6.tab')
}