| Tabulation of Results | ||
| treat x gender | ||
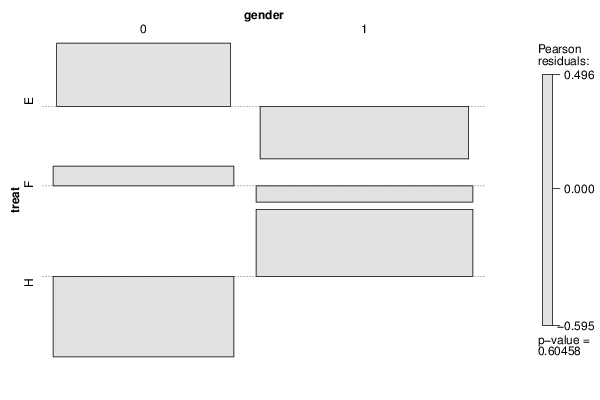
| 0 | 1 | E | 17 | 20 | F | 17 | 23 | H | 14 | 26 |
| Tabulation of Expected Results | ||
| treat x gender | ||
| 0 | 1 | E | 15.18 | 21.82 | F | 16.41 | 23.59 | H | 16.41 | 23.59 |
| Statistical Results | |
| Pearson's Chi-squared test with simulated p-value (based on 2000 replicates) | |
| Chi Square Statistic | 1.01 |
| P value | 0.63 |