| Tabulation of Results | ||
| pre x post | ||
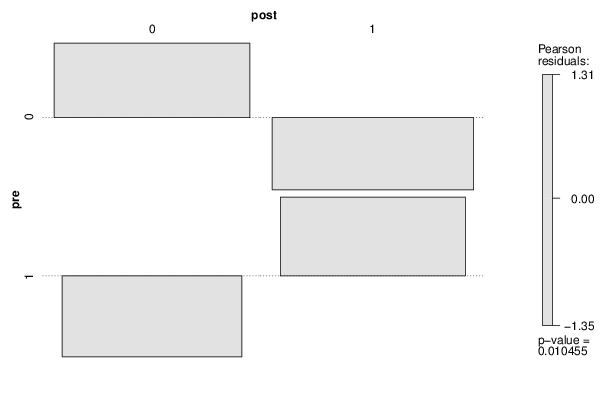
| 0 | 1 | 0 | 13 | 6 | 1 | 4 | 12 |
| Tabulation of Expected Results | ||
| pre x post | ||
| 0 | 1 | 0 | 9.23 | 9.77 | 1 | 7.77 | 8.23 |
| Statistical Results | |
| Pearson's Chi-squared test with Yates' continuity correction | |
| Pearson Chi Square Statistic | 4.93 |
| Degrees of Freedom | 1 |
| P value | 0.03 |