Free Statistics

of Irreproducible Research!

Author's title

Author*Unverified author*
R Software Module--
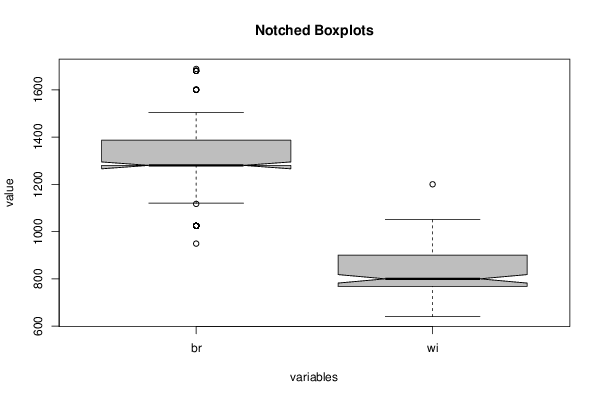
Title produced by softwareNotched Boxplots
Date of computationThu, 20 Dec 2012 10:39:45 -0500
Cite this page as followsStatistical Computations at FreeStatistics.org, Office for Research Development and Education, URL https://freestatistics.org/blog/index.php?v=date/2012/Dec/20/t1356017998cjzlfhnyb1p8cvz.htm/, Retrieved Fri, 19 Apr 2024 03:19:47 +0000
Statistical Computations at FreeStatistics.org, Office for Research Development and Education, URL https://freestatistics.org/blog/index.php?pk=202786, Retrieved Fri, 19 Apr 2024 03:19:47 +0000
QR Codes:

Original text written by user:
IsPrivate?No (this computation is public)
User-defined keywords
Estimated Impact80
Family? (F = Feedback message, R = changed R code, M = changed R Module, P = changed Parameters, D = changed Data)
-     [Notched Boxplots] [workshop 1 - task 7] [2011-10-04 13:46:01] [fbaf17a8836493f6de0f4e0e997711e1]
- R  D  [Notched Boxplots] [workshop 1 - task...] [2011-10-04 15:20:56] [fbaf17a8836493f6de0f4e0e997711e1]
-  M        [Notched Boxplots] [] [2012-12-20 15:39:45] [d41d8cd98f00b204e9800998ecf8427e] [Current]
Feedback Forum

Post a new message
Dataseries X:
1024	737
1024	640
1024	768
1024	768
1024	768
1024	768
1024	768
1024	768
1024	768
1024	768
1024	768
1024	768
1024	768
1024	768
1024	768
1024	768
1024	768
1024	768
1024	768
1024	768
1024	768
1117	768
1120	698
1140	700
1143	641
1152	857
1152	864
1176	864
1176	735
1257	735
1280	785
1280	768
1280	768
1280	768
1280	768
1280	800
1280	800
1280	800
1280	800
1280	800
1280	800
1280	800
1280	800
1280	800
1280	800
1280	800
1280	800
1280	800
1280	800
1280	800
1280	800
1280	800
1280	800
1280	800
1280	800
1280	800
1280	800
1280	800
1280	800
1280	800
1280	800
1280	800
1280	800
1280	800
1280	800
1280	800
1280	800
1280	800
1280	800
1280	800
1280	800
1280	800
1280	800
1280	800
1280	800
1280	800
1280	800
1280	800
1280	800
1280	800
1280	800
1280	800
1280	1024
1280	1024
1280	1024
1280	1024
1280	1024
1280	1024
1280	1024
1280	1024
1280	1024
1366	1024
1366	768
1366	768
1366	768
1366	768
1366	768
1366	768
1366	768
1408	768
1408	880
1440	880
1440	900
1440	900
1440	900
1440	900
1440	900
1440	900
1440	900
1440	900
1440	900
1440	900
1440	900
1440	900
1440	900
1440	900
1440	900
1440	900
1440	900
1440	900
1440	900
1440	900
1503	900
1600	845
1600	900
1600	900
1600	900
1600	900
1680	1200
1680	1050
1680	1050
1680	1050
1688	1050
	949
	990


Summary of computational transaction
Raw Inputview raw input (R code)
Raw Outputview raw output of R engine
Computing time1 seconds
R Server'Gwilym Jenkins' @ jenkins.wessa.net

\begin{tabular}{lllllllll}
\hline
Summary of computational transaction \tabularnewline
Raw Input & view raw input (R code)  \tabularnewline
Raw Output & view raw output of R engine  \tabularnewline
Computing time & 1 seconds \tabularnewline
R Server & 'Gwilym Jenkins' @ jenkins.wessa.net \tabularnewline
\hline
\end{tabular}
%Source: https://freestatistics.org/blog/index.php?pk=202786&T=0

[TABLE]
[ROW][C]Summary of computational transaction[/C][/ROW]
[ROW][C]Raw Input[/C][C]view raw input (R code) [/C][/ROW]
[ROW][C]Raw Output[/C][C]view raw output of R engine [/C][/ROW]
[ROW][C]Computing time[/C][C]1 seconds[/C][/ROW]
[ROW][C]R Server[/C][C]'Gwilym Jenkins' @ jenkins.wessa.net[/C][/ROW]
[/TABLE]
Source: https://freestatistics.org/blog/index.php?pk=202786&T=0

Globally Unique Identifier (entire table): ba.freestatistics.org/blog/index.php?pk=202786&T=0

As an alternative you can also use a QR Code:  

The GUIDs for individual cells are displayed in the table below:

Summary of computational transaction
Raw Inputview raw input (R code)
Raw Outputview raw output of R engine
Computing time1 seconds
R Server'Gwilym Jenkins' @ jenkins.wessa.net


Boxplot statistics
Variablelower whiskerlower hingemedianupper hingeupper whisker
br11201280128013871503
wi6407688009001050

\begin{tabular}{lllllllll}
\hline
Boxplot statistics \tabularnewline
Variable & lower whisker & lower hinge & median & upper hinge & upper whisker \tabularnewline
br & 1120 & 1280 & 1280 & 1387 & 1503 \tabularnewline
wi & 640 & 768 & 800 & 900 & 1050 \tabularnewline
\hline
\end{tabular}
%Source: https://freestatistics.org/blog/index.php?pk=202786&T=1

[TABLE]
[ROW][C]Boxplot statistics[/C][/ROW]
[ROW][C]Variable[/C][C]lower whisker[/C][C]lower hinge[/C][C]median[/C][C]upper hinge[/C][C]upper whisker[/C][/ROW]
[ROW][C]br[/C][C]1120[/C][C]1280[/C][C]1280[/C][C]1387[/C][C]1503[/C][/ROW]
[ROW][C]wi[/C][C]640[/C][C]768[/C][C]800[/C][C]900[/C][C]1050[/C][/ROW]
[/TABLE]
Source: https://freestatistics.org/blog/index.php?pk=202786&T=1

Globally Unique Identifier (entire table): ba.freestatistics.org/blog/index.php?pk=202786&T=1

As an alternative you can also use a QR Code:  

The GUIDs for individual cells are displayed in the table below:

Boxplot statistics
Variablelower whiskerlower hingemedianupper hingeupper whisker
br11201280128013871503
wi6407688009001050


Boxplot Notches
Variablelower boundmedianupper bound
br1265.4496318997812801294.55036810022
wi782.050013184777800817.949986815223

\begin{tabular}{lllllllll}
\hline
Boxplot Notches \tabularnewline
Variable & lower bound & median & upper bound \tabularnewline
br & 1265.44963189978 & 1280 & 1294.55036810022 \tabularnewline
wi & 782.050013184777 & 800 & 817.949986815223 \tabularnewline
\hline
\end{tabular}
%Source: https://freestatistics.org/blog/index.php?pk=202786&T=2

[TABLE]
[ROW][C]Boxplot Notches[/C][/ROW]
[ROW][C]Variable[/C][C]lower bound[/C][C]median[/C][C]upper bound[/C][/ROW]
[ROW][C]br[/C][C]1265.44963189978[/C][C]1280[/C][C]1294.55036810022[/C][/ROW]
[ROW][C]wi[/C][C]782.050013184777[/C][C]800[/C][C]817.949986815223[/C][/ROW]
[/TABLE]
Source: https://freestatistics.org/blog/index.php?pk=202786&T=2

Globally Unique Identifier (entire table): ba.freestatistics.org/blog/index.php?pk=202786&T=2

As an alternative you can also use a QR Code:  

The GUIDs for individual cells are displayed in the table below:

Boxplot Notches
Variablelower boundmedianupper bound
br1265.4496318997812801294.55036810022
wi782.050013184777800817.949986815223


Parameters (Session):
par1 = grey ;
Parameters (R input):
par1 = grey ; par2 = ; par3 = ; par4 = ; par5 = ; par6 = ; par7 = ; par8 = ; par9 = ; par10 = ; par11 = ; par12 = ; par13 = ; par14 = ; par15 = ; par16 = ; par17 = ; par18 = ; par19 = ; par20 = ;
R code (references can be found in the software module):
z <- as.data.frame(t(y))
bitmap(file='test1.png')
(r<-boxplot(z ,xlab=xlab,ylab=ylab,main=main,notch=TRUE,col=par1))
dev.off()
load(file='createtable')
a<-table.start()
a<-table.row.start(a)
a<-table.element(a,hyperlink('overview.htm','Boxplot statistics','Boxplot overview'),6,TRUE)
a<-table.row.end(a)
a<-table.row.start(a)
a<-table.element(a,'Variable',1,TRUE)
a<-table.element(a,hyperlink('lower_whisker.htm','lower whisker','definition of lower whisker'),1,TRUE)
a<-table.element(a,hyperlink('lower_hinge.htm','lower hinge','definition of lower hinge'),1,TRUE)
a<-table.element(a,hyperlink('central_tendency.htm','median','definitions about measures of central tendency'),1,TRUE)
a<-table.element(a,hyperlink('upper_hinge.htm','upper hinge','definition of upper hinge'),1,TRUE)
a<-table.element(a,hyperlink('upper_whisker.htm','upper whisker','definition of upper whisker'),1,TRUE)
a<-table.row.end(a)
for (i in 1:length(y[,1]))
{
a<-table.row.start(a)
a<-table.element(a,dimnames(t(x))[[2]][i],1,TRUE)
for (j in 1:5)
{
a<-table.element(a,r$stats[j,i])
}
a<-table.row.end(a)
}
a<-table.end(a)
table.save(a,file='mytable.tab')
a<-table.start()
a<-table.row.start(a)
a<-table.element(a,'Boxplot Notches',4,TRUE)
a<-table.row.end(a)
a<-table.row.start(a)
a<-table.element(a,'Variable',1,TRUE)
a<-table.element(a,'lower bound',1,TRUE)
a<-table.element(a,'median',1,TRUE)
a<-table.element(a,'upper bound',1,TRUE)
a<-table.row.end(a)
for (i in 1:length(y[,1]))
{
a<-table.row.start(a)
a<-table.element(a,dimnames(t(x))[[2]][i],1,TRUE)
a<-table.element(a,r$conf[1,i])
a<-table.element(a,r$stats[3,i])
a<-table.element(a,r$conf[2,i])
a<-table.row.end(a)
}
a<-table.end(a)
table.save(a,file='mytable1.tab')