| Tabulation of Results | ||
| A x B | ||
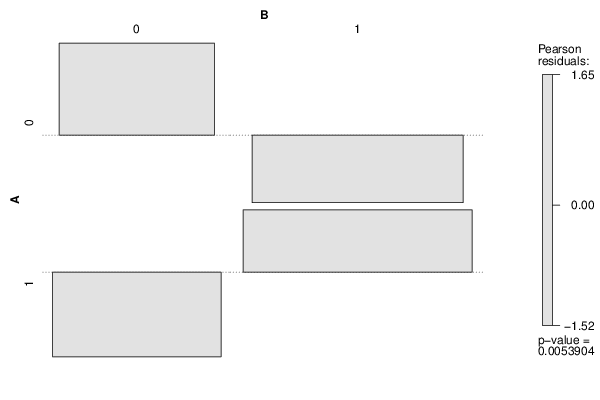
| 0 | 1 | 0 | 10 | 7 | 1 | 3 | 17 |
| Tabulation of Expected Results | ||
| A x B | ||
| 0 | 1 | 0 | 5.97 | 11.03 | 1 | 7.03 | 12.97 |
| Statistical Results | |
| Pearson's Chi-squared test with Yates' continuity correction | |
| Pearson Chi Square Statistic | 5.94 |
| Degrees of Freedom | 1 |
| P value | 0.01 |