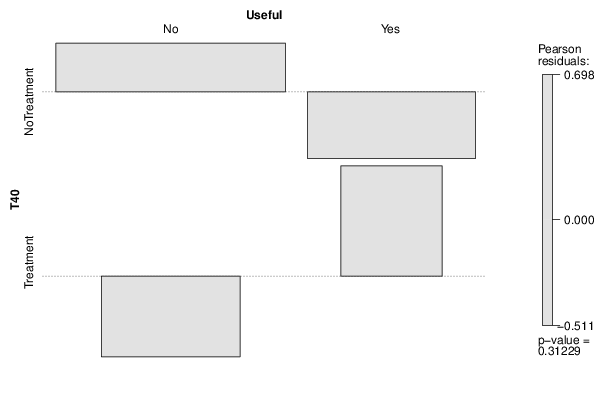
| Tabulation of Results | ||
| T40 x Useful | ||
| No | Yes | NoTreatment | 43 | 20 | Treatment | 13 | 10 |
| Tabulation of Expected Results | ||
| T40 x Useful | ||
| No | Yes | NoTreatment | 41.02 | 21.98 | Treatment | 14.98 | 8.02 |
| Statistical Results | |
| Pearson's Chi-squared test with Yates' continuity correction | |
| Pearson Chi Square Statistic | 0.57 |
| Degrees of Freedom | 1 |
| P value | 0.45 |