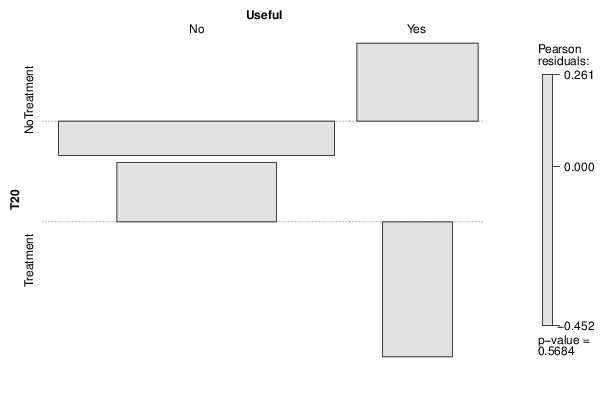
| Tabulation of Results | ||
| T20 x Useful | ||
| No | Yes | NoTreatment | 42 | 9 | Treatment | 15 | 2 |
| Tabulation of Expected Results | ||
| T20 x Useful | ||
| No | Yes | NoTreatment | 42.75 | 8.25 | Treatment | 14.25 | 2.75 |
| Statistical Results | |
| Pearson's Chi-squared test with simulated p-value (based on 2000 replicates) | |
| Exact Pearson Chi Square Statistic | 0.33 |
| P value | 0.73 |