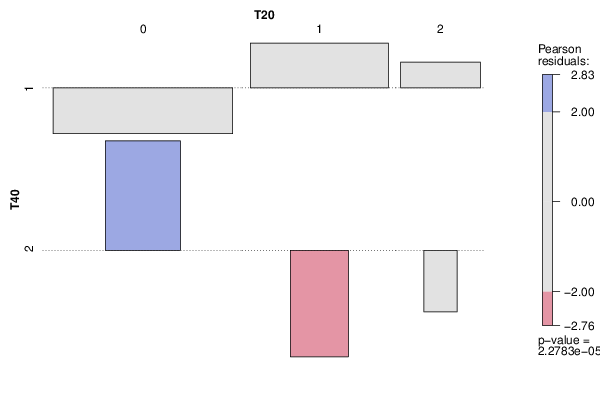
| Tabulation of Results | |||
| T40 x T20 | |||
| 0 | 1 | 2 | 1 | 63 | 51 | 17 | 2 | 23 | 0 | 0 |
| Tabulation of Expected Results | |||
| T40 x T20 | |||
| 0 | 1 | 2 | 1 | 73.16 | 43.38 | 14.46 | 2 | 12.84 | 7.62 | 2.54 |
| Statistical Results | |
| Pearson's Chi-squared test | |
| Pearson Chi Square Statistic | 21.38 |
| Degrees of Freedom | 2 |
| P value | 0 |