Free Statistics

of Irreproducible Research!

Author's title

Author*Unverified author*
R Software Modulerwasp_exponentialsmoothing.wasp
Title produced by softwareExponential Smoothing
Date of computationTue, 18 Dec 2012 17:02:56 -0500
Cite this page as followsStatistical Computations at FreeStatistics.org, Office for Research Development and Education, URL https://freestatistics.org/blog/index.php?v=date/2012/Dec/18/t1355868203ezzkagpge5rv9o8.htm/, Retrieved Tue, 23 Apr 2024 07:05:31 +0000
Statistical Computations at FreeStatistics.org, Office for Research Development and Education, URL https://freestatistics.org/blog/index.php?pk=201693, Retrieved Tue, 23 Apr 2024 07:05:31 +0000
QR Codes:

Original text written by user:
IsPrivate?No (this computation is public)
User-defined keywords
Estimated Impact72
Family? (F = Feedback message, R = changed R code, M = changed R Module, P = changed Parameters, D = changed Data)
-       [Exponential Smoothing] [] [2012-12-18 22:02:56] [d41d8cd98f00b204e9800998ecf8427e] [Current]
Feedback Forum

Post a new message
Dataseries X:
65
65.3
62.9
63.5
62.1
59.3
61.6
61.5
60.1
59.5
62.7
65.5
63.8
63.8
62.7
62.3
62.4
64.8
66.4
65.1
67.4
68.8
68.6
71.5
75
84.3
84
79.1
78.8
82.7
85.3
84.5
80.8
70.1
68.2
68.1
72.3
73.1
71.5
74.1
80.3
80.6
81.4
87.4
89.3
93.2
92.8
96.8
100.3
95.6
89
87.4
86.7
92.8
98.6
100.8
105.5
107.8
113.7
120.3
126.5
134.8
134.5
133.1
128.8
127.1
129.1
128.4
126.5
117.1
114.2
109.1


Summary of computational transaction
Raw Inputview raw input (R code)
Raw Outputview raw output of R engine
Computing time4 seconds
R Server'Herman Ole Andreas Wold' @ wold.wessa.net

\begin{tabular}{lllllllll}
\hline
Summary of computational transaction \tabularnewline
Raw Input & view raw input (R code)  \tabularnewline
Raw Output & view raw output of R engine  \tabularnewline
Computing time & 4 seconds \tabularnewline
R Server & 'Herman Ole Andreas Wold' @ wold.wessa.net \tabularnewline
\hline
\end{tabular}
%Source: https://freestatistics.org/blog/index.php?pk=201693&T=0

[TABLE]
[ROW][C]Summary of computational transaction[/C][/ROW]
[ROW][C]Raw Input[/C][C]view raw input (R code) [/C][/ROW]
[ROW][C]Raw Output[/C][C]view raw output of R engine [/C][/ROW]
[ROW][C]Computing time[/C][C]4 seconds[/C][/ROW]
[ROW][C]R Server[/C][C]'Herman Ole Andreas Wold' @ wold.wessa.net[/C][/ROW]
[/TABLE]
Source: https://freestatistics.org/blog/index.php?pk=201693&T=0

Globally Unique Identifier (entire table): ba.freestatistics.org/blog/index.php?pk=201693&T=0

As an alternative you can also use a QR Code:  

The GUIDs for individual cells are displayed in the table below:

Summary of computational transaction
Raw Inputview raw input (R code)
Raw Outputview raw output of R engine
Computing time4 seconds
R Server'Herman Ole Andreas Wold' @ wold.wessa.net


Estimated Parameters of Exponential Smoothing
ParameterValue
alpha1
beta0
gammaFALSE

\begin{tabular}{lllllllll}
\hline
Estimated Parameters of Exponential Smoothing \tabularnewline
Parameter & Value \tabularnewline
alpha & 1 \tabularnewline
beta & 0 \tabularnewline
gamma & FALSE \tabularnewline
\hline
\end{tabular}
%Source: https://freestatistics.org/blog/index.php?pk=201693&T=1

[TABLE]
[ROW][C]Estimated Parameters of Exponential Smoothing[/C][/ROW]
[ROW][C]Parameter[/C][C]Value[/C][/ROW]
[ROW][C]alpha[/C][C]1[/C][/ROW]
[ROW][C]beta[/C][C]0[/C][/ROW]
[ROW][C]gamma[/C][C]FALSE[/C][/ROW]
[/TABLE]
Source: https://freestatistics.org/blog/index.php?pk=201693&T=1

Globally Unique Identifier (entire table): ba.freestatistics.org/blog/index.php?pk=201693&T=1

As an alternative you can also use a QR Code:  

The GUIDs for individual cells are displayed in the table below:

Estimated Parameters of Exponential Smoothing
ParameterValue
alpha1
beta0
gammaFALSE


Interpolation Forecasts of Exponential Smoothing
tObservedFittedResiduals
362.965.6-2.7
463.563.20.300000000000004
562.163.8-1.7
659.362.4-3.1
761.659.62.00000000000001
861.561.9-0.399999999999999
960.161.8-1.7
1059.560.4-0.899999999999999
1162.759.82.90000000000001
1265.5632.5
1363.865.8-2
1463.864.1-0.299999999999997
1562.764.1-1.39999999999999
1662.363-0.700000000000003
1762.462.6-0.199999999999996
1864.862.72.1
1966.465.11.30000000000001
2065.166.7-1.60000000000001
2167.465.42.00000000000001
2268.867.71.09999999999999
2368.669.1-0.5
2471.568.92.60000000000001
257571.83.2
2684.375.39
278484.6-0.599999999999994
2879.184.3-5.2
2978.879.4-0.599999999999994
3082.779.13.60000000000001
3185.3832.3
3284.585.6-1.09999999999999
3380.884.8-4
3470.181.1-11
3568.270.4-2.19999999999999
3668.168.5-0.400000000000006
3772.368.43.90000000000001
3873.172.60.5
3971.573.4-1.89999999999999
4074.171.82.3
4180.374.45.90000000000001
4280.680.60
4381.480.90.500000000000014
4487.481.75.7
4589.387.71.59999999999999
4693.289.63.60000000000001
4792.893.5-0.700000000000003
4896.893.13.7
49100.397.13.2
5095.6100.6-5
518995.9-6.89999999999999
5287.489.3-1.89999999999999
5386.787.7-1
5492.8875.8
5598.693.15.5
56100.898.91.90000000000001
57105.5101.14.40000000000001
58107.8105.82
59113.7108.15.60000000000001
60120.31146.3
61126.5120.65.90000000000001
62134.8126.88.00000000000001
63134.5135.1-0.600000000000023
64133.1134.8-1.70000000000002
65128.8133.4-4.59999999999997
66127.1129.1-2.00000000000003
67129.1127.41.7
68128.4129.4-0.999999999999972
69126.5128.7-2.19999999999999
70117.1126.8-9.7
71114.2117.4-3.19999999999999
72109.1114.5-5.40000000000001

\begin{tabular}{lllllllll}
\hline
Interpolation Forecasts of Exponential Smoothing \tabularnewline
t & Observed & Fitted & Residuals \tabularnewline
3 & 62.9 & 65.6 & -2.7 \tabularnewline
4 & 63.5 & 63.2 & 0.300000000000004 \tabularnewline
5 & 62.1 & 63.8 & -1.7 \tabularnewline
6 & 59.3 & 62.4 & -3.1 \tabularnewline
7 & 61.6 & 59.6 & 2.00000000000001 \tabularnewline
8 & 61.5 & 61.9 & -0.399999999999999 \tabularnewline
9 & 60.1 & 61.8 & -1.7 \tabularnewline
10 & 59.5 & 60.4 & -0.899999999999999 \tabularnewline
11 & 62.7 & 59.8 & 2.90000000000001 \tabularnewline
12 & 65.5 & 63 & 2.5 \tabularnewline
13 & 63.8 & 65.8 & -2 \tabularnewline
14 & 63.8 & 64.1 & -0.299999999999997 \tabularnewline
15 & 62.7 & 64.1 & -1.39999999999999 \tabularnewline
16 & 62.3 & 63 & -0.700000000000003 \tabularnewline
17 & 62.4 & 62.6 & -0.199999999999996 \tabularnewline
18 & 64.8 & 62.7 & 2.1 \tabularnewline
19 & 66.4 & 65.1 & 1.30000000000001 \tabularnewline
20 & 65.1 & 66.7 & -1.60000000000001 \tabularnewline
21 & 67.4 & 65.4 & 2.00000000000001 \tabularnewline
22 & 68.8 & 67.7 & 1.09999999999999 \tabularnewline
23 & 68.6 & 69.1 & -0.5 \tabularnewline
24 & 71.5 & 68.9 & 2.60000000000001 \tabularnewline
25 & 75 & 71.8 & 3.2 \tabularnewline
26 & 84.3 & 75.3 & 9 \tabularnewline
27 & 84 & 84.6 & -0.599999999999994 \tabularnewline
28 & 79.1 & 84.3 & -5.2 \tabularnewline
29 & 78.8 & 79.4 & -0.599999999999994 \tabularnewline
30 & 82.7 & 79.1 & 3.60000000000001 \tabularnewline
31 & 85.3 & 83 & 2.3 \tabularnewline
32 & 84.5 & 85.6 & -1.09999999999999 \tabularnewline
33 & 80.8 & 84.8 & -4 \tabularnewline
34 & 70.1 & 81.1 & -11 \tabularnewline
35 & 68.2 & 70.4 & -2.19999999999999 \tabularnewline
36 & 68.1 & 68.5 & -0.400000000000006 \tabularnewline
37 & 72.3 & 68.4 & 3.90000000000001 \tabularnewline
38 & 73.1 & 72.6 & 0.5 \tabularnewline
39 & 71.5 & 73.4 & -1.89999999999999 \tabularnewline
40 & 74.1 & 71.8 & 2.3 \tabularnewline
41 & 80.3 & 74.4 & 5.90000000000001 \tabularnewline
42 & 80.6 & 80.6 & 0 \tabularnewline
43 & 81.4 & 80.9 & 0.500000000000014 \tabularnewline
44 & 87.4 & 81.7 & 5.7 \tabularnewline
45 & 89.3 & 87.7 & 1.59999999999999 \tabularnewline
46 & 93.2 & 89.6 & 3.60000000000001 \tabularnewline
47 & 92.8 & 93.5 & -0.700000000000003 \tabularnewline
48 & 96.8 & 93.1 & 3.7 \tabularnewline
49 & 100.3 & 97.1 & 3.2 \tabularnewline
50 & 95.6 & 100.6 & -5 \tabularnewline
51 & 89 & 95.9 & -6.89999999999999 \tabularnewline
52 & 87.4 & 89.3 & -1.89999999999999 \tabularnewline
53 & 86.7 & 87.7 & -1 \tabularnewline
54 & 92.8 & 87 & 5.8 \tabularnewline
55 & 98.6 & 93.1 & 5.5 \tabularnewline
56 & 100.8 & 98.9 & 1.90000000000001 \tabularnewline
57 & 105.5 & 101.1 & 4.40000000000001 \tabularnewline
58 & 107.8 & 105.8 & 2 \tabularnewline
59 & 113.7 & 108.1 & 5.60000000000001 \tabularnewline
60 & 120.3 & 114 & 6.3 \tabularnewline
61 & 126.5 & 120.6 & 5.90000000000001 \tabularnewline
62 & 134.8 & 126.8 & 8.00000000000001 \tabularnewline
63 & 134.5 & 135.1 & -0.600000000000023 \tabularnewline
64 & 133.1 & 134.8 & -1.70000000000002 \tabularnewline
65 & 128.8 & 133.4 & -4.59999999999997 \tabularnewline
66 & 127.1 & 129.1 & -2.00000000000003 \tabularnewline
67 & 129.1 & 127.4 & 1.7 \tabularnewline
68 & 128.4 & 129.4 & -0.999999999999972 \tabularnewline
69 & 126.5 & 128.7 & -2.19999999999999 \tabularnewline
70 & 117.1 & 126.8 & -9.7 \tabularnewline
71 & 114.2 & 117.4 & -3.19999999999999 \tabularnewline
72 & 109.1 & 114.5 & -5.40000000000001 \tabularnewline
\hline
\end{tabular}
%Source: https://freestatistics.org/blog/index.php?pk=201693&T=2

[TABLE]
[ROW][C]Interpolation Forecasts of Exponential Smoothing[/C][/ROW]
[ROW][C]t[/C][C]Observed[/C][C]Fitted[/C][C]Residuals[/C][/ROW]
[ROW][C]3[/C][C]62.9[/C][C]65.6[/C][C]-2.7[/C][/ROW]
[ROW][C]4[/C][C]63.5[/C][C]63.2[/C][C]0.300000000000004[/C][/ROW]
[ROW][C]5[/C][C]62.1[/C][C]63.8[/C][C]-1.7[/C][/ROW]
[ROW][C]6[/C][C]59.3[/C][C]62.4[/C][C]-3.1[/C][/ROW]
[ROW][C]7[/C][C]61.6[/C][C]59.6[/C][C]2.00000000000001[/C][/ROW]
[ROW][C]8[/C][C]61.5[/C][C]61.9[/C][C]-0.399999999999999[/C][/ROW]
[ROW][C]9[/C][C]60.1[/C][C]61.8[/C][C]-1.7[/C][/ROW]
[ROW][C]10[/C][C]59.5[/C][C]60.4[/C][C]-0.899999999999999[/C][/ROW]
[ROW][C]11[/C][C]62.7[/C][C]59.8[/C][C]2.90000000000001[/C][/ROW]
[ROW][C]12[/C][C]65.5[/C][C]63[/C][C]2.5[/C][/ROW]
[ROW][C]13[/C][C]63.8[/C][C]65.8[/C][C]-2[/C][/ROW]
[ROW][C]14[/C][C]63.8[/C][C]64.1[/C][C]-0.299999999999997[/C][/ROW]
[ROW][C]15[/C][C]62.7[/C][C]64.1[/C][C]-1.39999999999999[/C][/ROW]
[ROW][C]16[/C][C]62.3[/C][C]63[/C][C]-0.700000000000003[/C][/ROW]
[ROW][C]17[/C][C]62.4[/C][C]62.6[/C][C]-0.199999999999996[/C][/ROW]
[ROW][C]18[/C][C]64.8[/C][C]62.7[/C][C]2.1[/C][/ROW]
[ROW][C]19[/C][C]66.4[/C][C]65.1[/C][C]1.30000000000001[/C][/ROW]
[ROW][C]20[/C][C]65.1[/C][C]66.7[/C][C]-1.60000000000001[/C][/ROW]
[ROW][C]21[/C][C]67.4[/C][C]65.4[/C][C]2.00000000000001[/C][/ROW]
[ROW][C]22[/C][C]68.8[/C][C]67.7[/C][C]1.09999999999999[/C][/ROW]
[ROW][C]23[/C][C]68.6[/C][C]69.1[/C][C]-0.5[/C][/ROW]
[ROW][C]24[/C][C]71.5[/C][C]68.9[/C][C]2.60000000000001[/C][/ROW]
[ROW][C]25[/C][C]75[/C][C]71.8[/C][C]3.2[/C][/ROW]
[ROW][C]26[/C][C]84.3[/C][C]75.3[/C][C]9[/C][/ROW]
[ROW][C]27[/C][C]84[/C][C]84.6[/C][C]-0.599999999999994[/C][/ROW]
[ROW][C]28[/C][C]79.1[/C][C]84.3[/C][C]-5.2[/C][/ROW]
[ROW][C]29[/C][C]78.8[/C][C]79.4[/C][C]-0.599999999999994[/C][/ROW]
[ROW][C]30[/C][C]82.7[/C][C]79.1[/C][C]3.60000000000001[/C][/ROW]
[ROW][C]31[/C][C]85.3[/C][C]83[/C][C]2.3[/C][/ROW]
[ROW][C]32[/C][C]84.5[/C][C]85.6[/C][C]-1.09999999999999[/C][/ROW]
[ROW][C]33[/C][C]80.8[/C][C]84.8[/C][C]-4[/C][/ROW]
[ROW][C]34[/C][C]70.1[/C][C]81.1[/C][C]-11[/C][/ROW]
[ROW][C]35[/C][C]68.2[/C][C]70.4[/C][C]-2.19999999999999[/C][/ROW]
[ROW][C]36[/C][C]68.1[/C][C]68.5[/C][C]-0.400000000000006[/C][/ROW]
[ROW][C]37[/C][C]72.3[/C][C]68.4[/C][C]3.90000000000001[/C][/ROW]
[ROW][C]38[/C][C]73.1[/C][C]72.6[/C][C]0.5[/C][/ROW]
[ROW][C]39[/C][C]71.5[/C][C]73.4[/C][C]-1.89999999999999[/C][/ROW]
[ROW][C]40[/C][C]74.1[/C][C]71.8[/C][C]2.3[/C][/ROW]
[ROW][C]41[/C][C]80.3[/C][C]74.4[/C][C]5.90000000000001[/C][/ROW]
[ROW][C]42[/C][C]80.6[/C][C]80.6[/C][C]0[/C][/ROW]
[ROW][C]43[/C][C]81.4[/C][C]80.9[/C][C]0.500000000000014[/C][/ROW]
[ROW][C]44[/C][C]87.4[/C][C]81.7[/C][C]5.7[/C][/ROW]
[ROW][C]45[/C][C]89.3[/C][C]87.7[/C][C]1.59999999999999[/C][/ROW]
[ROW][C]46[/C][C]93.2[/C][C]89.6[/C][C]3.60000000000001[/C][/ROW]
[ROW][C]47[/C][C]92.8[/C][C]93.5[/C][C]-0.700000000000003[/C][/ROW]
[ROW][C]48[/C][C]96.8[/C][C]93.1[/C][C]3.7[/C][/ROW]
[ROW][C]49[/C][C]100.3[/C][C]97.1[/C][C]3.2[/C][/ROW]
[ROW][C]50[/C][C]95.6[/C][C]100.6[/C][C]-5[/C][/ROW]
[ROW][C]51[/C][C]89[/C][C]95.9[/C][C]-6.89999999999999[/C][/ROW]
[ROW][C]52[/C][C]87.4[/C][C]89.3[/C][C]-1.89999999999999[/C][/ROW]
[ROW][C]53[/C][C]86.7[/C][C]87.7[/C][C]-1[/C][/ROW]
[ROW][C]54[/C][C]92.8[/C][C]87[/C][C]5.8[/C][/ROW]
[ROW][C]55[/C][C]98.6[/C][C]93.1[/C][C]5.5[/C][/ROW]
[ROW][C]56[/C][C]100.8[/C][C]98.9[/C][C]1.90000000000001[/C][/ROW]
[ROW][C]57[/C][C]105.5[/C][C]101.1[/C][C]4.40000000000001[/C][/ROW]
[ROW][C]58[/C][C]107.8[/C][C]105.8[/C][C]2[/C][/ROW]
[ROW][C]59[/C][C]113.7[/C][C]108.1[/C][C]5.60000000000001[/C][/ROW]
[ROW][C]60[/C][C]120.3[/C][C]114[/C][C]6.3[/C][/ROW]
[ROW][C]61[/C][C]126.5[/C][C]120.6[/C][C]5.90000000000001[/C][/ROW]
[ROW][C]62[/C][C]134.8[/C][C]126.8[/C][C]8.00000000000001[/C][/ROW]
[ROW][C]63[/C][C]134.5[/C][C]135.1[/C][C]-0.600000000000023[/C][/ROW]
[ROW][C]64[/C][C]133.1[/C][C]134.8[/C][C]-1.70000000000002[/C][/ROW]
[ROW][C]65[/C][C]128.8[/C][C]133.4[/C][C]-4.59999999999997[/C][/ROW]
[ROW][C]66[/C][C]127.1[/C][C]129.1[/C][C]-2.00000000000003[/C][/ROW]
[ROW][C]67[/C][C]129.1[/C][C]127.4[/C][C]1.7[/C][/ROW]
[ROW][C]68[/C][C]128.4[/C][C]129.4[/C][C]-0.999999999999972[/C][/ROW]
[ROW][C]69[/C][C]126.5[/C][C]128.7[/C][C]-2.19999999999999[/C][/ROW]
[ROW][C]70[/C][C]117.1[/C][C]126.8[/C][C]-9.7[/C][/ROW]
[ROW][C]71[/C][C]114.2[/C][C]117.4[/C][C]-3.19999999999999[/C][/ROW]
[ROW][C]72[/C][C]109.1[/C][C]114.5[/C][C]-5.40000000000001[/C][/ROW]
[/TABLE]
Source: https://freestatistics.org/blog/index.php?pk=201693&T=2

Globally Unique Identifier (entire table): ba.freestatistics.org/blog/index.php?pk=201693&T=2

As an alternative you can also use a QR Code:  

The GUIDs for individual cells are displayed in the table below:

Interpolation Forecasts of Exponential Smoothing
tObservedFittedResiduals
362.965.6-2.7
463.563.20.300000000000004
562.163.8-1.7
659.362.4-3.1
761.659.62.00000000000001
861.561.9-0.399999999999999
960.161.8-1.7
1059.560.4-0.899999999999999
1162.759.82.90000000000001
1265.5632.5
1363.865.8-2
1463.864.1-0.299999999999997
1562.764.1-1.39999999999999
1662.363-0.700000000000003
1762.462.6-0.199999999999996
1864.862.72.1
1966.465.11.30000000000001
2065.166.7-1.60000000000001
2167.465.42.00000000000001
2268.867.71.09999999999999
2368.669.1-0.5
2471.568.92.60000000000001
257571.83.2
2684.375.39
278484.6-0.599999999999994
2879.184.3-5.2
2978.879.4-0.599999999999994
3082.779.13.60000000000001
3185.3832.3
3284.585.6-1.09999999999999
3380.884.8-4
3470.181.1-11
3568.270.4-2.19999999999999
3668.168.5-0.400000000000006
3772.368.43.90000000000001
3873.172.60.5
3971.573.4-1.89999999999999
4074.171.82.3
4180.374.45.90000000000001
4280.680.60
4381.480.90.500000000000014
4487.481.75.7
4589.387.71.59999999999999
4693.289.63.60000000000001
4792.893.5-0.700000000000003
4896.893.13.7
49100.397.13.2
5095.6100.6-5
518995.9-6.89999999999999
5287.489.3-1.89999999999999
5386.787.7-1
5492.8875.8
5598.693.15.5
56100.898.91.90000000000001
57105.5101.14.40000000000001
58107.8105.82
59113.7108.15.60000000000001
60120.31146.3
61126.5120.65.90000000000001
62134.8126.88.00000000000001
63134.5135.1-0.600000000000023
64133.1134.8-1.70000000000002
65128.8133.4-4.59999999999997
66127.1129.1-2.00000000000003
67129.1127.41.7
68128.4129.4-0.999999999999972
69126.5128.7-2.19999999999999
70117.1126.8-9.7
71114.2117.4-3.19999999999999
72109.1114.5-5.40000000000001


Extrapolation Forecasts of Exponential Smoothing
tForecast95% Lower Bound95% Upper Bound
73109.4102.001058495942116.798941504058
74109.799.2363165777563120.163683422244
7511097.1846573927418122.815342607258
76110.395.5021169918844125.097883008116
77110.694.0554638353822127.144536164618
78110.992.7763686783577129.023631321642
79111.291.6242408151489130.775759184851
80111.590.5726331555125132.427366844487
81111.889.6031754878266133.996824512173
82112.188.7024925728254135.497507427175
83112.487.8604871852524136.939512814748
84112.787.0693147854836138.330685214516

\begin{tabular}{lllllllll}
\hline
Extrapolation Forecasts of Exponential Smoothing \tabularnewline
t & Forecast & 95% Lower Bound & 95% Upper Bound \tabularnewline
73 & 109.4 & 102.001058495942 & 116.798941504058 \tabularnewline
74 & 109.7 & 99.2363165777563 & 120.163683422244 \tabularnewline
75 & 110 & 97.1846573927418 & 122.815342607258 \tabularnewline
76 & 110.3 & 95.5021169918844 & 125.097883008116 \tabularnewline
77 & 110.6 & 94.0554638353822 & 127.144536164618 \tabularnewline
78 & 110.9 & 92.7763686783577 & 129.023631321642 \tabularnewline
79 & 111.2 & 91.6242408151489 & 130.775759184851 \tabularnewline
80 & 111.5 & 90.5726331555125 & 132.427366844487 \tabularnewline
81 & 111.8 & 89.6031754878266 & 133.996824512173 \tabularnewline
82 & 112.1 & 88.7024925728254 & 135.497507427175 \tabularnewline
83 & 112.4 & 87.8604871852524 & 136.939512814748 \tabularnewline
84 & 112.7 & 87.0693147854836 & 138.330685214516 \tabularnewline
\hline
\end{tabular}
%Source: https://freestatistics.org/blog/index.php?pk=201693&T=3

[TABLE]
[ROW][C]Extrapolation Forecasts of Exponential Smoothing[/C][/ROW]
[ROW][C]t[/C][C]Forecast[/C][C]95% Lower Bound[/C][C]95% Upper Bound[/C][/ROW]
[ROW][C]73[/C][C]109.4[/C][C]102.001058495942[/C][C]116.798941504058[/C][/ROW]
[ROW][C]74[/C][C]109.7[/C][C]99.2363165777563[/C][C]120.163683422244[/C][/ROW]
[ROW][C]75[/C][C]110[/C][C]97.1846573927418[/C][C]122.815342607258[/C][/ROW]
[ROW][C]76[/C][C]110.3[/C][C]95.5021169918844[/C][C]125.097883008116[/C][/ROW]
[ROW][C]77[/C][C]110.6[/C][C]94.0554638353822[/C][C]127.144536164618[/C][/ROW]
[ROW][C]78[/C][C]110.9[/C][C]92.7763686783577[/C][C]129.023631321642[/C][/ROW]
[ROW][C]79[/C][C]111.2[/C][C]91.6242408151489[/C][C]130.775759184851[/C][/ROW]
[ROW][C]80[/C][C]111.5[/C][C]90.5726331555125[/C][C]132.427366844487[/C][/ROW]
[ROW][C]81[/C][C]111.8[/C][C]89.6031754878266[/C][C]133.996824512173[/C][/ROW]
[ROW][C]82[/C][C]112.1[/C][C]88.7024925728254[/C][C]135.497507427175[/C][/ROW]
[ROW][C]83[/C][C]112.4[/C][C]87.8604871852524[/C][C]136.939512814748[/C][/ROW]
[ROW][C]84[/C][C]112.7[/C][C]87.0693147854836[/C][C]138.330685214516[/C][/ROW]
[/TABLE]
Source: https://freestatistics.org/blog/index.php?pk=201693&T=3

Globally Unique Identifier (entire table): ba.freestatistics.org/blog/index.php?pk=201693&T=3

As an alternative you can also use a QR Code:  

The GUIDs for individual cells are displayed in the table below:

Extrapolation Forecasts of Exponential Smoothing
tForecast95% Lower Bound95% Upper Bound
73109.4102.001058495942116.798941504058
74109.799.2363165777563120.163683422244
7511097.1846573927418122.815342607258
76110.395.5021169918844125.097883008116
77110.694.0554638353822127.144536164618
78110.992.7763686783577129.023631321642
79111.291.6242408151489130.775759184851
80111.590.5726331555125132.427366844487
81111.889.6031754878266133.996824512173
82112.188.7024925728254135.497507427175
83112.487.8604871852524136.939512814748
84112.787.0693147854836138.330685214516


Parameters (Session):
par1 = 12 ; par2 = Double ; par3 = multiplicative ;
Parameters (R input):
par1 = 12 ; par2 = Double ; par3 = multiplicative ;
R code (references can be found in the software module):
par1 <- as.numeric(par1)
if (par2 == 'Single') K <- 1
if (par2 == 'Double') K <- 2
if (par2 == 'Triple') K <- par1
nx <- length(x)
nxmK <- nx - K
x <- ts(x, frequency = par1)
if (par2 == 'Single') fit <- HoltWinters(x, gamma=F, beta=F)
if (par2 == 'Double') fit <- HoltWinters(x, gamma=F)
if (par2 == 'Triple') fit <- HoltWinters(x, seasonal=par3)
fit
myresid <- x - fit$fitted[,'xhat']
bitmap(file='test1.png')
op <- par(mfrow=c(2,1))
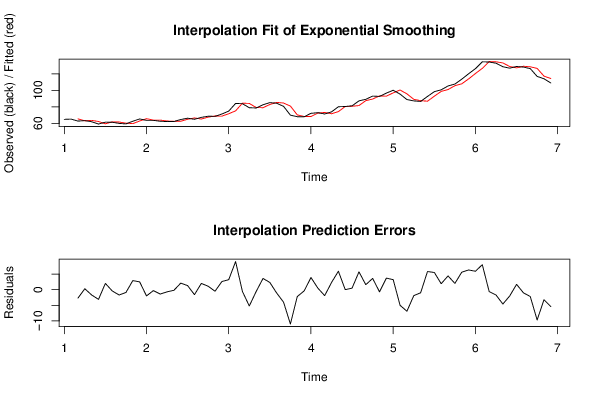
plot(fit,ylab='Observed (black) / Fitted (red)',main='Interpolation Fit of Exponential Smoothing')
plot(myresid,ylab='Residuals',main='Interpolation Prediction Errors')
par(op)
dev.off()
bitmap(file='test2.png')
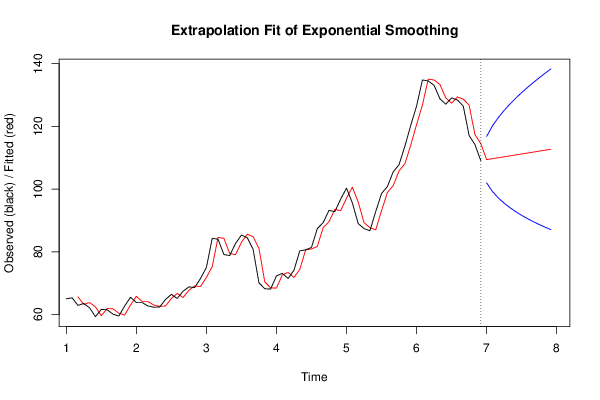
p <- predict(fit, par1, prediction.interval=TRUE)
np <- length(p[,1])
plot(fit,p,ylab='Observed (black) / Fitted (red)',main='Extrapolation Fit of Exponential Smoothing')
dev.off()
bitmap(file='test3.png')
op <- par(mfrow = c(2,2))
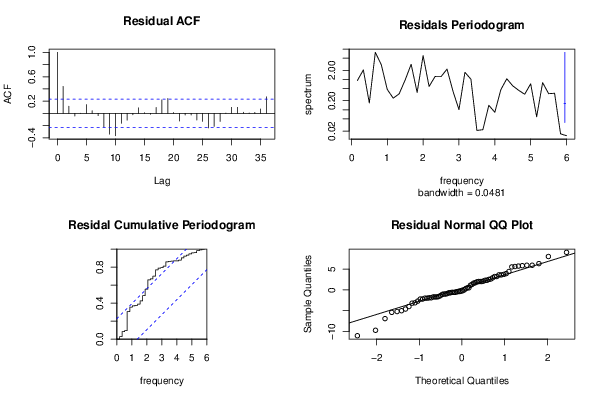
acf(as.numeric(myresid),lag.max = nx/2,main='Residual ACF')
spectrum(myresid,main='Residals Periodogram')
cpgram(myresid,main='Residal Cumulative Periodogram')
qqnorm(myresid,main='Residual Normal QQ Plot')
qqline(myresid)
par(op)
dev.off()
load(file='createtable')
a<-table.start()
a<-table.row.start(a)
a<-table.element(a,'Estimated Parameters of Exponential Smoothing',2,TRUE)
a<-table.row.end(a)
a<-table.row.start(a)
a<-table.element(a,'Parameter',header=TRUE)
a<-table.element(a,'Value',header=TRUE)
a<-table.row.end(a)
a<-table.row.start(a)
a<-table.element(a,'alpha',header=TRUE)
a<-table.element(a,fit$alpha)
a<-table.row.end(a)
a<-table.row.start(a)
a<-table.element(a,'beta',header=TRUE)
a<-table.element(a,fit$beta)
a<-table.row.end(a)
a<-table.row.start(a)
a<-table.element(a,'gamma',header=TRUE)
a<-table.element(a,fit$gamma)
a<-table.row.end(a)
a<-table.end(a)
table.save(a,file='mytable.tab')
a<-table.start()
a<-table.row.start(a)
a<-table.element(a,'Interpolation Forecasts of Exponential Smoothing',4,TRUE)
a<-table.row.end(a)
a<-table.row.start(a)
a<-table.element(a,'t',header=TRUE)
a<-table.element(a,'Observed',header=TRUE)
a<-table.element(a,'Fitted',header=TRUE)
a<-table.element(a,'Residuals',header=TRUE)
a<-table.row.end(a)
for (i in 1:nxmK) {
a<-table.row.start(a)
a<-table.element(a,i+K,header=TRUE)
a<-table.element(a,x[i+K])
a<-table.element(a,fit$fitted[i,'xhat'])
a<-table.element(a,myresid[i])
a<-table.row.end(a)
}
a<-table.end(a)
table.save(a,file='mytable1.tab')
a<-table.start()
a<-table.row.start(a)
a<-table.element(a,'Extrapolation Forecasts of Exponential Smoothing',4,TRUE)
a<-table.row.end(a)
a<-table.row.start(a)
a<-table.element(a,'t',header=TRUE)
a<-table.element(a,'Forecast',header=TRUE)
a<-table.element(a,'95% Lower Bound',header=TRUE)
a<-table.element(a,'95% Upper Bound',header=TRUE)
a<-table.row.end(a)
for (i in 1:np) {
a<-table.row.start(a)
a<-table.element(a,nx+i,header=TRUE)
a<-table.element(a,p[i,'fit'])
a<-table.element(a,p[i,'lwr'])
a<-table.element(a,p[i,'upr'])
a<-table.row.end(a)
}
a<-table.end(a)
table.save(a,file='mytable2.tab')