Free Statistics

of Irreproducible Research!

Author's title

Author*The author of this computation has been verified*
R Software Modulerwasp_notchedbox1.wasp
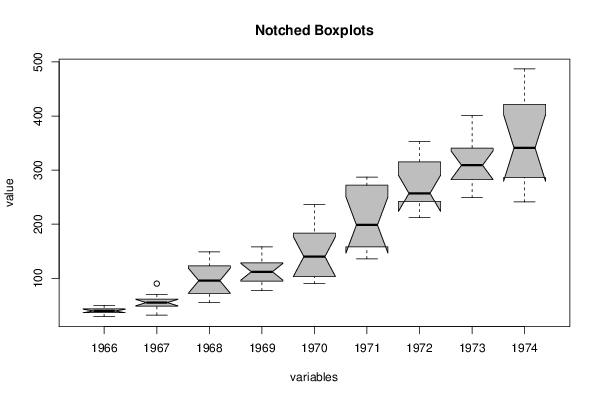
Title produced by softwareNotched Boxplots
Date of computationTue, 18 Dec 2012 13:37:53 -0500
Cite this page as followsStatistical Computations at FreeStatistics.org, Office for Research Development and Education, URL https://freestatistics.org/blog/index.php?v=date/2012/Dec/18/t13558559057g6on2wt0qrbphv.htm/, Retrieved Thu, 25 Apr 2024 22:04:30 +0000
Statistical Computations at FreeStatistics.org, Office for Research Development and Education, URL https://freestatistics.org/blog/index.php?pk=201555, Retrieved Thu, 25 Apr 2024 22:04:30 +0000
QR Codes:

Original text written by user:
IsPrivate?No (this computation is public)
User-defined keywords
Estimated Impact79
Family? (F = Feedback message, R = changed R code, M = changed R Module, P = changed Parameters, D = changed Data)
-       [Notched Boxplots] [Paper_Notched_Box...] [2012-12-18 18:37:53] [b38599bd3d78365f281c5a627888d89a] [Current]
Feedback Forum

Post a new message
Dataseries X:
41	50	74	158	99	136	238	298	327
39	59	62	124	107	161	213	273	324
50	63	55	140	112	171	257	312	285
40	32	84	109	90	149	293	249	243
43	39	94	114	98	184	212	286	241
38	47	70	77	125	155	246	279	287
44	53	108	120	155	276	353	309	355
35	60	139	133	190	224	339	401	460
39	57	120	110	236	213	308	309	364
35	52	97	92	189	279	247	328	487
29	70	126	97	174	268	257	353	452
49	90	149	78	178	287	322	354	391


Summary of computational transaction
Raw Inputview raw input (R code)
Raw Outputview raw output of R engine
Computing time2 seconds
R Server'George Udny Yule' @ yule.wessa.net

\begin{tabular}{lllllllll}
\hline
Summary of computational transaction \tabularnewline
Raw Input & view raw input (R code)  \tabularnewline
Raw Output & view raw output of R engine  \tabularnewline
Computing time & 2 seconds \tabularnewline
R Server & 'George Udny Yule' @ yule.wessa.net \tabularnewline
\hline
\end{tabular}
%Source: https://freestatistics.org/blog/index.php?pk=201555&T=0

[TABLE]
[ROW][C]Summary of computational transaction[/C][/ROW]
[ROW][C]Raw Input[/C][C]view raw input (R code) [/C][/ROW]
[ROW][C]Raw Output[/C][C]view raw output of R engine [/C][/ROW]
[ROW][C]Computing time[/C][C]2 seconds[/C][/ROW]
[ROW][C]R Server[/C][C]'George Udny Yule' @ yule.wessa.net[/C][/ROW]
[/TABLE]
Source: https://freestatistics.org/blog/index.php?pk=201555&T=0

Globally Unique Identifier (entire table): ba.freestatistics.org/blog/index.php?pk=201555&T=0

As an alternative you can also use a QR Code:  

The GUIDs for individual cells are displayed in the table below:

Summary of computational transaction
Raw Inputview raw input (R code)
Raw Outputview raw output of R engine
Computing time2 seconds
R Server'George Udny Yule' @ yule.wessa.net


Boxplot statistics
Variablelower whiskerlower hingemedianupper hingeupper whisker
19662936.539.543.550
19673248.55561.570
1968557295.5123149
19697794.5112128.5158
197090103140183.5236
1971136158198.5272287
1972212242257315353
1973249282.5309340.5401
1974241286341421.5487

\begin{tabular}{lllllllll}
\hline
Boxplot statistics \tabularnewline
Variable & lower whisker & lower hinge & median & upper hinge & upper whisker \tabularnewline
1966 & 29 & 36.5 & 39.5 & 43.5 & 50 \tabularnewline
1967 & 32 & 48.5 & 55 & 61.5 & 70 \tabularnewline
1968 & 55 & 72 & 95.5 & 123 & 149 \tabularnewline
1969 & 77 & 94.5 & 112 & 128.5 & 158 \tabularnewline
1970 & 90 & 103 & 140 & 183.5 & 236 \tabularnewline
1971 & 136 & 158 & 198.5 & 272 & 287 \tabularnewline
1972 & 212 & 242 & 257 & 315 & 353 \tabularnewline
1973 & 249 & 282.5 & 309 & 340.5 & 401 \tabularnewline
1974 & 241 & 286 & 341 & 421.5 & 487 \tabularnewline
\hline
\end{tabular}
%Source: https://freestatistics.org/blog/index.php?pk=201555&T=1

[TABLE]
[ROW][C]Boxplot statistics[/C][/ROW]
[ROW][C]Variable[/C][C]lower whisker[/C][C]lower hinge[/C][C]median[/C][C]upper hinge[/C][C]upper whisker[/C][/ROW]
[ROW][C]1966[/C][C]29[/C][C]36.5[/C][C]39.5[/C][C]43.5[/C][C]50[/C][/ROW]
[ROW][C]1967[/C][C]32[/C][C]48.5[/C][C]55[/C][C]61.5[/C][C]70[/C][/ROW]
[ROW][C]1968[/C][C]55[/C][C]72[/C][C]95.5[/C][C]123[/C][C]149[/C][/ROW]
[ROW][C]1969[/C][C]77[/C][C]94.5[/C][C]112[/C][C]128.5[/C][C]158[/C][/ROW]
[ROW][C]1970[/C][C]90[/C][C]103[/C][C]140[/C][C]183.5[/C][C]236[/C][/ROW]
[ROW][C]1971[/C][C]136[/C][C]158[/C][C]198.5[/C][C]272[/C][C]287[/C][/ROW]
[ROW][C]1972[/C][C]212[/C][C]242[/C][C]257[/C][C]315[/C][C]353[/C][/ROW]
[ROW][C]1973[/C][C]249[/C][C]282.5[/C][C]309[/C][C]340.5[/C][C]401[/C][/ROW]
[ROW][C]1974[/C][C]241[/C][C]286[/C][C]341[/C][C]421.5[/C][C]487[/C][/ROW]
[/TABLE]
Source: https://freestatistics.org/blog/index.php?pk=201555&T=1

Globally Unique Identifier (entire table): ba.freestatistics.org/blog/index.php?pk=201555&T=1

As an alternative you can also use a QR Code:  

The GUIDs for individual cells are displayed in the table below:

Boxplot statistics
Variablelower whiskerlower hingemedianupper hingeupper whisker
19662936.539.543.550
19673248.55561.570
1968557295.5123149
19697794.5112128.5158
197090103140183.5236
1971136158198.5272287
1972212242257315353
1973249282.5309340.5401
1974241286341421.5487


Boxplot Notches
Variablelower boundmedianupper bound
196636.307253011381439.542.6927469886186
196749.07061273542255560.9293872645775
196872.2385576543595.5118.76144234565
196996.4923717695666112127.507628230433
1970103.283409630886140176.716590369114
1971146.503834756782198.5250.496165243218
1972223.704209975834257290.295790024166
1973282.545810665731309335.454189334269
1974279.197540434596341402.802459565404

\begin{tabular}{lllllllll}
\hline
Boxplot Notches \tabularnewline
Variable & lower bound & median & upper bound \tabularnewline
1966 & 36.3072530113814 & 39.5 & 42.6927469886186 \tabularnewline
1967 & 49.0706127354225 & 55 & 60.9293872645775 \tabularnewline
1968 & 72.23855765435 & 95.5 & 118.76144234565 \tabularnewline
1969 & 96.4923717695666 & 112 & 127.507628230433 \tabularnewline
1970 & 103.283409630886 & 140 & 176.716590369114 \tabularnewline
1971 & 146.503834756782 & 198.5 & 250.496165243218 \tabularnewline
1972 & 223.704209975834 & 257 & 290.295790024166 \tabularnewline
1973 & 282.545810665731 & 309 & 335.454189334269 \tabularnewline
1974 & 279.197540434596 & 341 & 402.802459565404 \tabularnewline
\hline
\end{tabular}
%Source: https://freestatistics.org/blog/index.php?pk=201555&T=2

[TABLE]
[ROW][C]Boxplot Notches[/C][/ROW]
[ROW][C]Variable[/C][C]lower bound[/C][C]median[/C][C]upper bound[/C][/ROW]
[ROW][C]1966[/C][C]36.3072530113814[/C][C]39.5[/C][C]42.6927469886186[/C][/ROW]
[ROW][C]1967[/C][C]49.0706127354225[/C][C]55[/C][C]60.9293872645775[/C][/ROW]
[ROW][C]1968[/C][C]72.23855765435[/C][C]95.5[/C][C]118.76144234565[/C][/ROW]
[ROW][C]1969[/C][C]96.4923717695666[/C][C]112[/C][C]127.507628230433[/C][/ROW]
[ROW][C]1970[/C][C]103.283409630886[/C][C]140[/C][C]176.716590369114[/C][/ROW]
[ROW][C]1971[/C][C]146.503834756782[/C][C]198.5[/C][C]250.496165243218[/C][/ROW]
[ROW][C]1972[/C][C]223.704209975834[/C][C]257[/C][C]290.295790024166[/C][/ROW]
[ROW][C]1973[/C][C]282.545810665731[/C][C]309[/C][C]335.454189334269[/C][/ROW]
[ROW][C]1974[/C][C]279.197540434596[/C][C]341[/C][C]402.802459565404[/C][/ROW]
[/TABLE]
Source: https://freestatistics.org/blog/index.php?pk=201555&T=2

Globally Unique Identifier (entire table): ba.freestatistics.org/blog/index.php?pk=201555&T=2

As an alternative you can also use a QR Code:  

The GUIDs for individual cells are displayed in the table below:

Boxplot Notches
Variablelower boundmedianupper bound
196636.307253011381439.542.6927469886186
196749.07061273542255560.9293872645775
196872.2385576543595.5118.76144234565
196996.4923717695666112127.507628230433
1970103.283409630886140176.716590369114
1971146.503834756782198.5250.496165243218
1972223.704209975834257290.295790024166
1973282.545810665731309335.454189334269
1974279.197540434596341402.802459565404


Parameters (Session):
par1 = grey ;
Parameters (R input):
par1 = grey ;
R code (references can be found in the software module):
z <- as.data.frame(t(y))
bitmap(file='test1.png')
(r<-boxplot(z ,xlab=xlab,ylab=ylab,main=main,notch=TRUE,col=par1))
dev.off()
load(file='createtable')
a<-table.start()
a<-table.row.start(a)
a<-table.element(a,hyperlink('overview.htm','Boxplot statistics','Boxplot overview'),6,TRUE)
a<-table.row.end(a)
a<-table.row.start(a)
a<-table.element(a,'Variable',1,TRUE)
a<-table.element(a,hyperlink('lower_whisker.htm','lower whisker','definition of lower whisker'),1,TRUE)
a<-table.element(a,hyperlink('lower_hinge.htm','lower hinge','definition of lower hinge'),1,TRUE)
a<-table.element(a,hyperlink('central_tendency.htm','median','definitions about measures of central tendency'),1,TRUE)
a<-table.element(a,hyperlink('upper_hinge.htm','upper hinge','definition of upper hinge'),1,TRUE)
a<-table.element(a,hyperlink('upper_whisker.htm','upper whisker','definition of upper whisker'),1,TRUE)
a<-table.row.end(a)
for (i in 1:length(y[,1]))
{
a<-table.row.start(a)
a<-table.element(a,dimnames(t(x))[[2]][i],1,TRUE)
for (j in 1:5)
{
a<-table.element(a,r$stats[j,i])
}
a<-table.row.end(a)
}
a<-table.end(a)
table.save(a,file='mytable.tab')
a<-table.start()
a<-table.row.start(a)
a<-table.element(a,'Boxplot Notches',4,TRUE)
a<-table.row.end(a)
a<-table.row.start(a)
a<-table.element(a,'Variable',1,TRUE)
a<-table.element(a,'lower bound',1,TRUE)
a<-table.element(a,'median',1,TRUE)
a<-table.element(a,'upper bound',1,TRUE)
a<-table.row.end(a)
for (i in 1:length(y[,1]))
{
a<-table.row.start(a)
a<-table.element(a,dimnames(t(x))[[2]][i],1,TRUE)
a<-table.element(a,r$conf[1,i])
a<-table.element(a,r$stats[3,i])
a<-table.element(a,r$conf[2,i])
a<-table.row.end(a)
}
a<-table.end(a)
table.save(a,file='mytable1.tab')