Free Statistics

of Irreproducible Research!

Author's title

Author*The author of this computation has been verified*
R Software Modulerwasp_autocorrelation.wasp
Title produced by software(Partial) Autocorrelation Function
Date of computationTue, 18 Dec 2012 06:46:27 -0500
Cite this page as followsStatistical Computations at FreeStatistics.org, Office for Research Development and Education, URL https://freestatistics.org/blog/index.php?v=date/2012/Dec/18/t1355831206ko9u7d81027gaxt.htm/, Retrieved Fri, 19 Apr 2024 19:33:45 +0000
Statistical Computations at FreeStatistics.org, Office for Research Development and Education, URL https://freestatistics.org/blog/index.php?pk=201390, Retrieved Fri, 19 Apr 2024 19:33:45 +0000
QR Codes:

Original text written by user:
IsPrivate?No (this computation is public)
User-defined keywords
Estimated Impact147
Family? (F = Feedback message, R = changed R code, M = changed R Module, P = changed Parameters, D = changed Data)
-       [(Partial) Autocorrelation Function] [autocorrelation f...] [2012-12-18 11:46:27] [239167cccea8953a8e1721fd6db07280] [Current]
Feedback Forum

Post a new message
Dataseries X:
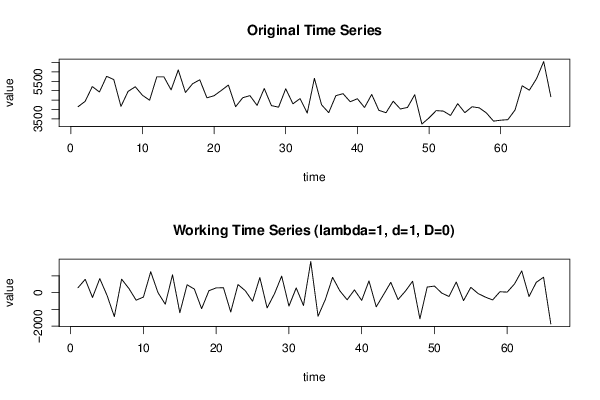
4143
4429
5219
4929
5761
5592
4163
4962
5208
4755
4491
5732
5731
5040
6102
4904
5369
5578
4619
4731
5011
5299
4146
4625
4736
4219
5116
4205
4121
5103
4300
4578
3809
5657
4248
3830
4736
4839
4411
4570
4104
4801
3953
3828
4440
4026
4109
4785
3224
3552
3940
3913
3681
4309
3830
4143
4087
3818
3380
3430
3458
3970
5260
5024
5634
6549
4676


Summary of computational transaction
Raw Inputview raw input (R code)
Raw Outputview raw output of R engine
Computing time3 seconds
R Server'Sir Ronald Aylmer Fisher' @ fisher.wessa.net

\begin{tabular}{lllllllll}
\hline
Summary of computational transaction \tabularnewline
Raw Input & view raw input (R code)  \tabularnewline
Raw Output & view raw output of R engine  \tabularnewline
Computing time & 3 seconds \tabularnewline
R Server & 'Sir Ronald Aylmer Fisher' @ fisher.wessa.net \tabularnewline
\hline
\end{tabular}
%Source: https://freestatistics.org/blog/index.php?pk=201390&T=0

[TABLE]
[ROW][C]Summary of computational transaction[/C][/ROW]
[ROW][C]Raw Input[/C][C]view raw input (R code) [/C][/ROW]
[ROW][C]Raw Output[/C][C]view raw output of R engine [/C][/ROW]
[ROW][C]Computing time[/C][C]3 seconds[/C][/ROW]
[ROW][C]R Server[/C][C]'Sir Ronald Aylmer Fisher' @ fisher.wessa.net[/C][/ROW]
[/TABLE]
Source: https://freestatistics.org/blog/index.php?pk=201390&T=0

Globally Unique Identifier (entire table): ba.freestatistics.org/blog/index.php?pk=201390&T=0

As an alternative you can also use a QR Code:  

The GUIDs for individual cells are displayed in the table below:

Summary of computational transaction
Raw Inputview raw input (R code)
Raw Outputview raw output of R engine
Computing time3 seconds
R Server'Sir Ronald Aylmer Fisher' @ fisher.wessa.net


Autocorrelation Function
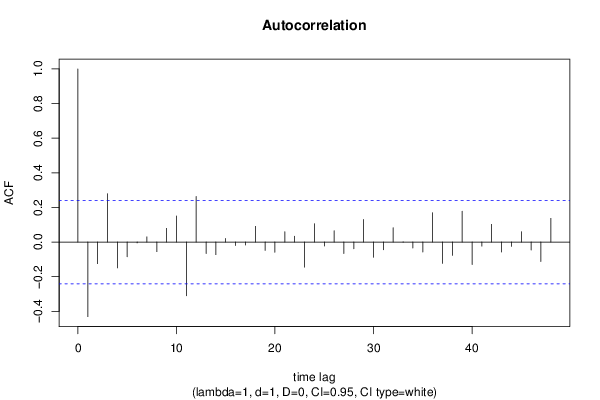
Time lag kACF(k)T-STATP-value
1-0.430859-3.50030.000419
2-0.124519-1.01160.157713
30.2789632.26630.013359
4-0.149166-1.21180.114948
5-0.084833-0.68920.246561
6-0.004593-0.03730.485173
70.0301910.24530.403502
8-0.055179-0.44830.32771
90.0791360.64290.261258
100.1508471.22550.112373
11-0.310175-2.51990.007084
120.2635352.1410.017987
13-0.065684-0.53360.2977
14-0.072825-0.59160.278059
150.0207920.16890.433189
16-0.020346-0.16530.434609
17-0.017022-0.13830.445219
180.0907790.73750.231718
19-0.047987-0.38980.348952
20-0.059335-0.4820.315685
210.0593240.48190.315718
220.0334350.27160.393379
23-0.14466-1.17520.122064
240.106160.86240.195782
25-0.023141-0.1880.425728
260.0655240.53230.298147
27-0.065897-0.53530.297104
28-0.038356-0.31160.378162
290.1306551.06140.146178
30-0.087862-0.71380.238935
31-0.044844-0.36430.358395
320.0825390.67050.252424
33-0.001201-0.00980.496121
34-0.03442-0.27960.390317
35-0.057309-0.46560.321524
360.1691771.37440.086983
37-0.123286-1.00160.160102
38-0.077123-0.62650.266558
390.1781041.44690.076325
40-0.129277-1.05030.148716
41-0.023708-0.19260.423929
420.1024440.83230.204132
43-0.057734-0.4690.320296
44-0.025057-0.20360.41966
450.0593180.48190.315734
46-0.045843-0.37240.355383
47-0.112734-0.91590.181539
480.1367641.11110.135284

\begin{tabular}{lllllllll}
\hline
Autocorrelation Function \tabularnewline
Time lag k & ACF(k) & T-STAT & P-value \tabularnewline
1 & -0.430859 & -3.5003 & 0.000419 \tabularnewline
2 & -0.124519 & -1.0116 & 0.157713 \tabularnewline
3 & 0.278963 & 2.2663 & 0.013359 \tabularnewline
4 & -0.149166 & -1.2118 & 0.114948 \tabularnewline
5 & -0.084833 & -0.6892 & 0.246561 \tabularnewline
6 & -0.004593 & -0.0373 & 0.485173 \tabularnewline
7 & 0.030191 & 0.2453 & 0.403502 \tabularnewline
8 & -0.055179 & -0.4483 & 0.32771 \tabularnewline
9 & 0.079136 & 0.6429 & 0.261258 \tabularnewline
10 & 0.150847 & 1.2255 & 0.112373 \tabularnewline
11 & -0.310175 & -2.5199 & 0.007084 \tabularnewline
12 & 0.263535 & 2.141 & 0.017987 \tabularnewline
13 & -0.065684 & -0.5336 & 0.2977 \tabularnewline
14 & -0.072825 & -0.5916 & 0.278059 \tabularnewline
15 & 0.020792 & 0.1689 & 0.433189 \tabularnewline
16 & -0.020346 & -0.1653 & 0.434609 \tabularnewline
17 & -0.017022 & -0.1383 & 0.445219 \tabularnewline
18 & 0.090779 & 0.7375 & 0.231718 \tabularnewline
19 & -0.047987 & -0.3898 & 0.348952 \tabularnewline
20 & -0.059335 & -0.482 & 0.315685 \tabularnewline
21 & 0.059324 & 0.4819 & 0.315718 \tabularnewline
22 & 0.033435 & 0.2716 & 0.393379 \tabularnewline
23 & -0.14466 & -1.1752 & 0.122064 \tabularnewline
24 & 0.10616 & 0.8624 & 0.195782 \tabularnewline
25 & -0.023141 & -0.188 & 0.425728 \tabularnewline
26 & 0.065524 & 0.5323 & 0.298147 \tabularnewline
27 & -0.065897 & -0.5353 & 0.297104 \tabularnewline
28 & -0.038356 & -0.3116 & 0.378162 \tabularnewline
29 & 0.130655 & 1.0614 & 0.146178 \tabularnewline
30 & -0.087862 & -0.7138 & 0.238935 \tabularnewline
31 & -0.044844 & -0.3643 & 0.358395 \tabularnewline
32 & 0.082539 & 0.6705 & 0.252424 \tabularnewline
33 & -0.001201 & -0.0098 & 0.496121 \tabularnewline
34 & -0.03442 & -0.2796 & 0.390317 \tabularnewline
35 & -0.057309 & -0.4656 & 0.321524 \tabularnewline
36 & 0.169177 & 1.3744 & 0.086983 \tabularnewline
37 & -0.123286 & -1.0016 & 0.160102 \tabularnewline
38 & -0.077123 & -0.6265 & 0.266558 \tabularnewline
39 & 0.178104 & 1.4469 & 0.076325 \tabularnewline
40 & -0.129277 & -1.0503 & 0.148716 \tabularnewline
41 & -0.023708 & -0.1926 & 0.423929 \tabularnewline
42 & 0.102444 & 0.8323 & 0.204132 \tabularnewline
43 & -0.057734 & -0.469 & 0.320296 \tabularnewline
44 & -0.025057 & -0.2036 & 0.41966 \tabularnewline
45 & 0.059318 & 0.4819 & 0.315734 \tabularnewline
46 & -0.045843 & -0.3724 & 0.355383 \tabularnewline
47 & -0.112734 & -0.9159 & 0.181539 \tabularnewline
48 & 0.136764 & 1.1111 & 0.135284 \tabularnewline
\hline
\end{tabular}
%Source: https://freestatistics.org/blog/index.php?pk=201390&T=1

[TABLE]
[ROW][C]Autocorrelation Function[/C][/ROW]
[ROW][C]Time lag k[/C][C]ACF(k)[/C][C]T-STAT[/C][C]P-value[/C][/ROW]
[ROW][C]1[/C][C]-0.430859[/C][C]-3.5003[/C][C]0.000419[/C][/ROW]
[ROW][C]2[/C][C]-0.124519[/C][C]-1.0116[/C][C]0.157713[/C][/ROW]
[ROW][C]3[/C][C]0.278963[/C][C]2.2663[/C][C]0.013359[/C][/ROW]
[ROW][C]4[/C][C]-0.149166[/C][C]-1.2118[/C][C]0.114948[/C][/ROW]
[ROW][C]5[/C][C]-0.084833[/C][C]-0.6892[/C][C]0.246561[/C][/ROW]
[ROW][C]6[/C][C]-0.004593[/C][C]-0.0373[/C][C]0.485173[/C][/ROW]
[ROW][C]7[/C][C]0.030191[/C][C]0.2453[/C][C]0.403502[/C][/ROW]
[ROW][C]8[/C][C]-0.055179[/C][C]-0.4483[/C][C]0.32771[/C][/ROW]
[ROW][C]9[/C][C]0.079136[/C][C]0.6429[/C][C]0.261258[/C][/ROW]
[ROW][C]10[/C][C]0.150847[/C][C]1.2255[/C][C]0.112373[/C][/ROW]
[ROW][C]11[/C][C]-0.310175[/C][C]-2.5199[/C][C]0.007084[/C][/ROW]
[ROW][C]12[/C][C]0.263535[/C][C]2.141[/C][C]0.017987[/C][/ROW]
[ROW][C]13[/C][C]-0.065684[/C][C]-0.5336[/C][C]0.2977[/C][/ROW]
[ROW][C]14[/C][C]-0.072825[/C][C]-0.5916[/C][C]0.278059[/C][/ROW]
[ROW][C]15[/C][C]0.020792[/C][C]0.1689[/C][C]0.433189[/C][/ROW]
[ROW][C]16[/C][C]-0.020346[/C][C]-0.1653[/C][C]0.434609[/C][/ROW]
[ROW][C]17[/C][C]-0.017022[/C][C]-0.1383[/C][C]0.445219[/C][/ROW]
[ROW][C]18[/C][C]0.090779[/C][C]0.7375[/C][C]0.231718[/C][/ROW]
[ROW][C]19[/C][C]-0.047987[/C][C]-0.3898[/C][C]0.348952[/C][/ROW]
[ROW][C]20[/C][C]-0.059335[/C][C]-0.482[/C][C]0.315685[/C][/ROW]
[ROW][C]21[/C][C]0.059324[/C][C]0.4819[/C][C]0.315718[/C][/ROW]
[ROW][C]22[/C][C]0.033435[/C][C]0.2716[/C][C]0.393379[/C][/ROW]
[ROW][C]23[/C][C]-0.14466[/C][C]-1.1752[/C][C]0.122064[/C][/ROW]
[ROW][C]24[/C][C]0.10616[/C][C]0.8624[/C][C]0.195782[/C][/ROW]
[ROW][C]25[/C][C]-0.023141[/C][C]-0.188[/C][C]0.425728[/C][/ROW]
[ROW][C]26[/C][C]0.065524[/C][C]0.5323[/C][C]0.298147[/C][/ROW]
[ROW][C]27[/C][C]-0.065897[/C][C]-0.5353[/C][C]0.297104[/C][/ROW]
[ROW][C]28[/C][C]-0.038356[/C][C]-0.3116[/C][C]0.378162[/C][/ROW]
[ROW][C]29[/C][C]0.130655[/C][C]1.0614[/C][C]0.146178[/C][/ROW]
[ROW][C]30[/C][C]-0.087862[/C][C]-0.7138[/C][C]0.238935[/C][/ROW]
[ROW][C]31[/C][C]-0.044844[/C][C]-0.3643[/C][C]0.358395[/C][/ROW]
[ROW][C]32[/C][C]0.082539[/C][C]0.6705[/C][C]0.252424[/C][/ROW]
[ROW][C]33[/C][C]-0.001201[/C][C]-0.0098[/C][C]0.496121[/C][/ROW]
[ROW][C]34[/C][C]-0.03442[/C][C]-0.2796[/C][C]0.390317[/C][/ROW]
[ROW][C]35[/C][C]-0.057309[/C][C]-0.4656[/C][C]0.321524[/C][/ROW]
[ROW][C]36[/C][C]0.169177[/C][C]1.3744[/C][C]0.086983[/C][/ROW]
[ROW][C]37[/C][C]-0.123286[/C][C]-1.0016[/C][C]0.160102[/C][/ROW]
[ROW][C]38[/C][C]-0.077123[/C][C]-0.6265[/C][C]0.266558[/C][/ROW]
[ROW][C]39[/C][C]0.178104[/C][C]1.4469[/C][C]0.076325[/C][/ROW]
[ROW][C]40[/C][C]-0.129277[/C][C]-1.0503[/C][C]0.148716[/C][/ROW]
[ROW][C]41[/C][C]-0.023708[/C][C]-0.1926[/C][C]0.423929[/C][/ROW]
[ROW][C]42[/C][C]0.102444[/C][C]0.8323[/C][C]0.204132[/C][/ROW]
[ROW][C]43[/C][C]-0.057734[/C][C]-0.469[/C][C]0.320296[/C][/ROW]
[ROW][C]44[/C][C]-0.025057[/C][C]-0.2036[/C][C]0.41966[/C][/ROW]
[ROW][C]45[/C][C]0.059318[/C][C]0.4819[/C][C]0.315734[/C][/ROW]
[ROW][C]46[/C][C]-0.045843[/C][C]-0.3724[/C][C]0.355383[/C][/ROW]
[ROW][C]47[/C][C]-0.112734[/C][C]-0.9159[/C][C]0.181539[/C][/ROW]
[ROW][C]48[/C][C]0.136764[/C][C]1.1111[/C][C]0.135284[/C][/ROW]
[/TABLE]
Source: https://freestatistics.org/blog/index.php?pk=201390&T=1

Globally Unique Identifier (entire table): ba.freestatistics.org/blog/index.php?pk=201390&T=1

As an alternative you can also use a QR Code:  

The GUIDs for individual cells are displayed in the table below:

Autocorrelation Function
Time lag kACF(k)T-STATP-value
1-0.430859-3.50030.000419
2-0.124519-1.01160.157713
30.2789632.26630.013359
4-0.149166-1.21180.114948
5-0.084833-0.68920.246561
6-0.004593-0.03730.485173
70.0301910.24530.403502
8-0.055179-0.44830.32771
90.0791360.64290.261258
100.1508471.22550.112373
11-0.310175-2.51990.007084
120.2635352.1410.017987
13-0.065684-0.53360.2977
14-0.072825-0.59160.278059
150.0207920.16890.433189
16-0.020346-0.16530.434609
17-0.017022-0.13830.445219
180.0907790.73750.231718
19-0.047987-0.38980.348952
20-0.059335-0.4820.315685
210.0593240.48190.315718
220.0334350.27160.393379
23-0.14466-1.17520.122064
240.106160.86240.195782
25-0.023141-0.1880.425728
260.0655240.53230.298147
27-0.065897-0.53530.297104
28-0.038356-0.31160.378162
290.1306551.06140.146178
30-0.087862-0.71380.238935
31-0.044844-0.36430.358395
320.0825390.67050.252424
33-0.001201-0.00980.496121
34-0.03442-0.27960.390317
35-0.057309-0.46560.321524
360.1691771.37440.086983
37-0.123286-1.00160.160102
38-0.077123-0.62650.266558
390.1781041.44690.076325
40-0.129277-1.05030.148716
41-0.023708-0.19260.423929
420.1024440.83230.204132
43-0.057734-0.4690.320296
44-0.025057-0.20360.41966
450.0593180.48190.315734
46-0.045843-0.37240.355383
47-0.112734-0.91590.181539
480.1367641.11110.135284


Partial Autocorrelation Function
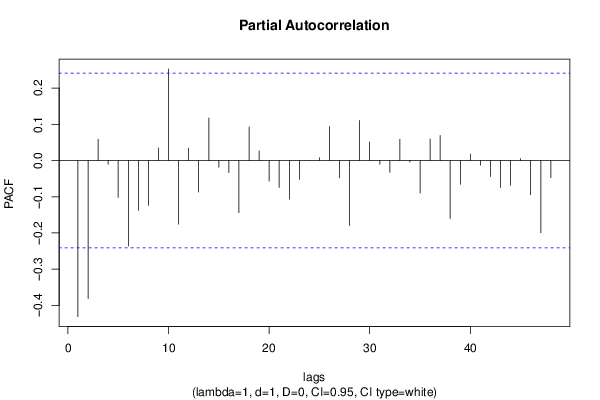
Time lag kPACF(k)T-STATP-value
1-0.430859-3.50030.000419
2-0.380861-3.09410.001447
30.0585770.47590.317866
4-0.010472-0.08510.46623
5-0.10175-0.82660.205715
6-0.235515-1.91330.030022
7-0.137499-1.1170.134012
8-0.123823-1.00590.159059
90.0345690.28080.389854
100.2526952.05290.022025
11-0.175587-1.42650.079222
120.0343390.2790.390569
13-0.087024-0.7070.241032
140.1171410.95170.172371
15-0.018825-0.15290.439458
16-0.03334-0.27090.393675
17-0.143809-1.16830.123442
180.0925360.75180.227433
190.0263280.21390.415646
20-0.05695-0.46270.322563
21-0.074146-0.60240.274499
22-0.106534-0.86550.194954
23-0.052143-0.42360.336613
24-0.000315-0.00260.498982
250.0078540.06380.474658
260.0938950.76280.224148
27-0.047599-0.38670.350113
28-0.179392-1.45740.074876
290.1106670.89910.185943
300.0510350.41460.339886
31-0.010503-0.08530.466128
32-0.032428-0.26340.396513
330.058710.4770.317483
34-0.003914-0.03180.487364
35-0.090067-0.73170.233468
360.0591380.48040.316253
370.0691460.56170.288097
38-0.159944-1.29940.099165
39-0.065602-0.5330.297928
400.0176920.14370.443077
41-0.012782-0.10380.458806
42-0.044283-0.35980.360089
43-0.074294-0.60360.274101
44-0.068579-0.55710.289659
450.0053320.04330.482791
46-0.094128-0.76470.223587
47-0.199301-1.61910.055094
48-0.047525-0.38610.350333

\begin{tabular}{lllllllll}
\hline
Partial Autocorrelation Function \tabularnewline
Time lag k & PACF(k) & T-STAT & P-value \tabularnewline
1 & -0.430859 & -3.5003 & 0.000419 \tabularnewline
2 & -0.380861 & -3.0941 & 0.001447 \tabularnewline
3 & 0.058577 & 0.4759 & 0.317866 \tabularnewline
4 & -0.010472 & -0.0851 & 0.46623 \tabularnewline
5 & -0.10175 & -0.8266 & 0.205715 \tabularnewline
6 & -0.235515 & -1.9133 & 0.030022 \tabularnewline
7 & -0.137499 & -1.117 & 0.134012 \tabularnewline
8 & -0.123823 & -1.0059 & 0.159059 \tabularnewline
9 & 0.034569 & 0.2808 & 0.389854 \tabularnewline
10 & 0.252695 & 2.0529 & 0.022025 \tabularnewline
11 & -0.175587 & -1.4265 & 0.079222 \tabularnewline
12 & 0.034339 & 0.279 & 0.390569 \tabularnewline
13 & -0.087024 & -0.707 & 0.241032 \tabularnewline
14 & 0.117141 & 0.9517 & 0.172371 \tabularnewline
15 & -0.018825 & -0.1529 & 0.439458 \tabularnewline
16 & -0.03334 & -0.2709 & 0.393675 \tabularnewline
17 & -0.143809 & -1.1683 & 0.123442 \tabularnewline
18 & 0.092536 & 0.7518 & 0.227433 \tabularnewline
19 & 0.026328 & 0.2139 & 0.415646 \tabularnewline
20 & -0.05695 & -0.4627 & 0.322563 \tabularnewline
21 & -0.074146 & -0.6024 & 0.274499 \tabularnewline
22 & -0.106534 & -0.8655 & 0.194954 \tabularnewline
23 & -0.052143 & -0.4236 & 0.336613 \tabularnewline
24 & -0.000315 & -0.0026 & 0.498982 \tabularnewline
25 & 0.007854 & 0.0638 & 0.474658 \tabularnewline
26 & 0.093895 & 0.7628 & 0.224148 \tabularnewline
27 & -0.047599 & -0.3867 & 0.350113 \tabularnewline
28 & -0.179392 & -1.4574 & 0.074876 \tabularnewline
29 & 0.110667 & 0.8991 & 0.185943 \tabularnewline
30 & 0.051035 & 0.4146 & 0.339886 \tabularnewline
31 & -0.010503 & -0.0853 & 0.466128 \tabularnewline
32 & -0.032428 & -0.2634 & 0.396513 \tabularnewline
33 & 0.05871 & 0.477 & 0.317483 \tabularnewline
34 & -0.003914 & -0.0318 & 0.487364 \tabularnewline
35 & -0.090067 & -0.7317 & 0.233468 \tabularnewline
36 & 0.059138 & 0.4804 & 0.316253 \tabularnewline
37 & 0.069146 & 0.5617 & 0.288097 \tabularnewline
38 & -0.159944 & -1.2994 & 0.099165 \tabularnewline
39 & -0.065602 & -0.533 & 0.297928 \tabularnewline
40 & 0.017692 & 0.1437 & 0.443077 \tabularnewline
41 & -0.012782 & -0.1038 & 0.458806 \tabularnewline
42 & -0.044283 & -0.3598 & 0.360089 \tabularnewline
43 & -0.074294 & -0.6036 & 0.274101 \tabularnewline
44 & -0.068579 & -0.5571 & 0.289659 \tabularnewline
45 & 0.005332 & 0.0433 & 0.482791 \tabularnewline
46 & -0.094128 & -0.7647 & 0.223587 \tabularnewline
47 & -0.199301 & -1.6191 & 0.055094 \tabularnewline
48 & -0.047525 & -0.3861 & 0.350333 \tabularnewline
\hline
\end{tabular}
%Source: https://freestatistics.org/blog/index.php?pk=201390&T=2

[TABLE]
[ROW][C]Partial Autocorrelation Function[/C][/ROW]
[ROW][C]Time lag k[/C][C]PACF(k)[/C][C]T-STAT[/C][C]P-value[/C][/ROW]
[ROW][C]1[/C][C]-0.430859[/C][C]-3.5003[/C][C]0.000419[/C][/ROW]
[ROW][C]2[/C][C]-0.380861[/C][C]-3.0941[/C][C]0.001447[/C][/ROW]
[ROW][C]3[/C][C]0.058577[/C][C]0.4759[/C][C]0.317866[/C][/ROW]
[ROW][C]4[/C][C]-0.010472[/C][C]-0.0851[/C][C]0.46623[/C][/ROW]
[ROW][C]5[/C][C]-0.10175[/C][C]-0.8266[/C][C]0.205715[/C][/ROW]
[ROW][C]6[/C][C]-0.235515[/C][C]-1.9133[/C][C]0.030022[/C][/ROW]
[ROW][C]7[/C][C]-0.137499[/C][C]-1.117[/C][C]0.134012[/C][/ROW]
[ROW][C]8[/C][C]-0.123823[/C][C]-1.0059[/C][C]0.159059[/C][/ROW]
[ROW][C]9[/C][C]0.034569[/C][C]0.2808[/C][C]0.389854[/C][/ROW]
[ROW][C]10[/C][C]0.252695[/C][C]2.0529[/C][C]0.022025[/C][/ROW]
[ROW][C]11[/C][C]-0.175587[/C][C]-1.4265[/C][C]0.079222[/C][/ROW]
[ROW][C]12[/C][C]0.034339[/C][C]0.279[/C][C]0.390569[/C][/ROW]
[ROW][C]13[/C][C]-0.087024[/C][C]-0.707[/C][C]0.241032[/C][/ROW]
[ROW][C]14[/C][C]0.117141[/C][C]0.9517[/C][C]0.172371[/C][/ROW]
[ROW][C]15[/C][C]-0.018825[/C][C]-0.1529[/C][C]0.439458[/C][/ROW]
[ROW][C]16[/C][C]-0.03334[/C][C]-0.2709[/C][C]0.393675[/C][/ROW]
[ROW][C]17[/C][C]-0.143809[/C][C]-1.1683[/C][C]0.123442[/C][/ROW]
[ROW][C]18[/C][C]0.092536[/C][C]0.7518[/C][C]0.227433[/C][/ROW]
[ROW][C]19[/C][C]0.026328[/C][C]0.2139[/C][C]0.415646[/C][/ROW]
[ROW][C]20[/C][C]-0.05695[/C][C]-0.4627[/C][C]0.322563[/C][/ROW]
[ROW][C]21[/C][C]-0.074146[/C][C]-0.6024[/C][C]0.274499[/C][/ROW]
[ROW][C]22[/C][C]-0.106534[/C][C]-0.8655[/C][C]0.194954[/C][/ROW]
[ROW][C]23[/C][C]-0.052143[/C][C]-0.4236[/C][C]0.336613[/C][/ROW]
[ROW][C]24[/C][C]-0.000315[/C][C]-0.0026[/C][C]0.498982[/C][/ROW]
[ROW][C]25[/C][C]0.007854[/C][C]0.0638[/C][C]0.474658[/C][/ROW]
[ROW][C]26[/C][C]0.093895[/C][C]0.7628[/C][C]0.224148[/C][/ROW]
[ROW][C]27[/C][C]-0.047599[/C][C]-0.3867[/C][C]0.350113[/C][/ROW]
[ROW][C]28[/C][C]-0.179392[/C][C]-1.4574[/C][C]0.074876[/C][/ROW]
[ROW][C]29[/C][C]0.110667[/C][C]0.8991[/C][C]0.185943[/C][/ROW]
[ROW][C]30[/C][C]0.051035[/C][C]0.4146[/C][C]0.339886[/C][/ROW]
[ROW][C]31[/C][C]-0.010503[/C][C]-0.0853[/C][C]0.466128[/C][/ROW]
[ROW][C]32[/C][C]-0.032428[/C][C]-0.2634[/C][C]0.396513[/C][/ROW]
[ROW][C]33[/C][C]0.05871[/C][C]0.477[/C][C]0.317483[/C][/ROW]
[ROW][C]34[/C][C]-0.003914[/C][C]-0.0318[/C][C]0.487364[/C][/ROW]
[ROW][C]35[/C][C]-0.090067[/C][C]-0.7317[/C][C]0.233468[/C][/ROW]
[ROW][C]36[/C][C]0.059138[/C][C]0.4804[/C][C]0.316253[/C][/ROW]
[ROW][C]37[/C][C]0.069146[/C][C]0.5617[/C][C]0.288097[/C][/ROW]
[ROW][C]38[/C][C]-0.159944[/C][C]-1.2994[/C][C]0.099165[/C][/ROW]
[ROW][C]39[/C][C]-0.065602[/C][C]-0.533[/C][C]0.297928[/C][/ROW]
[ROW][C]40[/C][C]0.017692[/C][C]0.1437[/C][C]0.443077[/C][/ROW]
[ROW][C]41[/C][C]-0.012782[/C][C]-0.1038[/C][C]0.458806[/C][/ROW]
[ROW][C]42[/C][C]-0.044283[/C][C]-0.3598[/C][C]0.360089[/C][/ROW]
[ROW][C]43[/C][C]-0.074294[/C][C]-0.6036[/C][C]0.274101[/C][/ROW]
[ROW][C]44[/C][C]-0.068579[/C][C]-0.5571[/C][C]0.289659[/C][/ROW]
[ROW][C]45[/C][C]0.005332[/C][C]0.0433[/C][C]0.482791[/C][/ROW]
[ROW][C]46[/C][C]-0.094128[/C][C]-0.7647[/C][C]0.223587[/C][/ROW]
[ROW][C]47[/C][C]-0.199301[/C][C]-1.6191[/C][C]0.055094[/C][/ROW]
[ROW][C]48[/C][C]-0.047525[/C][C]-0.3861[/C][C]0.350333[/C][/ROW]
[/TABLE]
Source: https://freestatistics.org/blog/index.php?pk=201390&T=2

Globally Unique Identifier (entire table): ba.freestatistics.org/blog/index.php?pk=201390&T=2

As an alternative you can also use a QR Code:  

The GUIDs for individual cells are displayed in the table below:

Partial Autocorrelation Function
Time lag kPACF(k)T-STATP-value
1-0.430859-3.50030.000419
2-0.380861-3.09410.001447
30.0585770.47590.317866
4-0.010472-0.08510.46623
5-0.10175-0.82660.205715
6-0.235515-1.91330.030022
7-0.137499-1.1170.134012
8-0.123823-1.00590.159059
90.0345690.28080.389854
100.2526952.05290.022025
11-0.175587-1.42650.079222
120.0343390.2790.390569
13-0.087024-0.7070.241032
140.1171410.95170.172371
15-0.018825-0.15290.439458
16-0.03334-0.27090.393675
17-0.143809-1.16830.123442
180.0925360.75180.227433
190.0263280.21390.415646
20-0.05695-0.46270.322563
21-0.074146-0.60240.274499
22-0.106534-0.86550.194954
23-0.052143-0.42360.336613
24-0.000315-0.00260.498982
250.0078540.06380.474658
260.0938950.76280.224148
27-0.047599-0.38670.350113
28-0.179392-1.45740.074876
290.1106670.89910.185943
300.0510350.41460.339886
31-0.010503-0.08530.466128
32-0.032428-0.26340.396513
330.058710.4770.317483
34-0.003914-0.03180.487364
35-0.090067-0.73170.233468
360.0591380.48040.316253
370.0691460.56170.288097
38-0.159944-1.29940.099165
39-0.065602-0.5330.297928
400.0176920.14370.443077
41-0.012782-0.10380.458806
42-0.044283-0.35980.360089
43-0.074294-0.60360.274101
44-0.068579-0.55710.289659
450.0053320.04330.482791
46-0.094128-0.76470.223587
47-0.199301-1.61910.055094
48-0.047525-0.38610.350333


Parameters (Session):
par1 = 48 ; par2 = 1 ; par3 = 1 ; par4 = 0 ; par5 = 12 ; par6 = White Noise ; par7 = 0.95 ;
Parameters (R input):
par1 = 48 ; par2 = 1 ; par3 = 1 ; par4 = 0 ; par5 = 12 ; par6 = White Noise ; par7 = 0.95 ; par8 = ;
R code (references can be found in the software module):
if (par1 == 'Default') {
par1 = 10*log10(length(x))
} else {
par1 <- as.numeric(par1)
}
par2 <- as.numeric(par2)
par3 <- as.numeric(par3)
par4 <- as.numeric(par4)
par5 <- as.numeric(par5)
if (par6 == 'White Noise') par6 <- 'white' else par6 <- 'ma'
par7 <- as.numeric(par7)
if (par8 != '') par8 <- as.numeric(par8)
ox <- x
if (par8 == '') {
if (par2 == 0) {
x <- log(x)
} else {
x <- (x ^ par2 - 1) / par2
}
} else {
x <- log(x,base=par8)
}
if (par3 > 0) x <- diff(x,lag=1,difference=par3)
if (par4 > 0) x <- diff(x,lag=par5,difference=par4)
bitmap(file='picts.png')
op <- par(mfrow=c(2,1))
plot(ox,type='l',main='Original Time Series',xlab='time',ylab='value')
if (par8=='') {
mytitle <- paste('Working Time Series (lambda=',par2,', d=',par3,', D=',par4,')',sep='')
mysub <- paste('(lambda=',par2,', d=',par3,', D=',par4,', CI=', par7, ', CI type=',par6,')',sep='')
} else {
mytitle <- paste('Working Time Series (base=',par8,', d=',par3,', D=',par4,')',sep='')
mysub <- paste('(base=',par8,', d=',par3,', D=',par4,', CI=', par7, ', CI type=',par6,')',sep='')
}
plot(x,type='l', main=mytitle,xlab='time',ylab='value')
par(op)
dev.off()
bitmap(file='pic1.png')
racf <- acf(x, par1, main='Autocorrelation', xlab='time lag', ylab='ACF', ci.type=par6, ci=par7, sub=mysub)
dev.off()
bitmap(file='pic2.png')
rpacf <- pacf(x,par1,main='Partial Autocorrelation',xlab='lags',ylab='PACF',sub=mysub)
dev.off()
(myacf <- c(racf$acf))
(mypacf <- c(rpacf$acf))
lengthx <- length(x)
sqrtn <- sqrt(lengthx)
load(file='createtable')
a<-table.start()
a<-table.row.start(a)
a<-table.element(a,'Autocorrelation Function',4,TRUE)
a<-table.row.end(a)
a<-table.row.start(a)
a<-table.element(a,'Time lag k',header=TRUE)
a<-table.element(a,hyperlink('basics.htm','ACF(k)','click here for more information about the Autocorrelation Function'),header=TRUE)
a<-table.element(a,'T-STAT',header=TRUE)
a<-table.element(a,'P-value',header=TRUE)
a<-table.row.end(a)
for (i in 2:(par1+1)) {
a<-table.row.start(a)
a<-table.element(a,i-1,header=TRUE)
a<-table.element(a,round(myacf[i],6))
mytstat <- myacf[i]*sqrtn
a<-table.element(a,round(mytstat,4))
a<-table.element(a,round(1-pt(abs(mytstat),lengthx),6))
a<-table.row.end(a)
}
a<-table.end(a)
table.save(a,file='mytable.tab')
a<-table.start()
a<-table.row.start(a)
a<-table.element(a,'Partial Autocorrelation Function',4,TRUE)
a<-table.row.end(a)
a<-table.row.start(a)
a<-table.element(a,'Time lag k',header=TRUE)
a<-table.element(a,hyperlink('basics.htm','PACF(k)','click here for more information about the Partial Autocorrelation Function'),header=TRUE)
a<-table.element(a,'T-STAT',header=TRUE)
a<-table.element(a,'P-value',header=TRUE)
a<-table.row.end(a)
for (i in 1:par1) {
a<-table.row.start(a)
a<-table.element(a,i,header=TRUE)
a<-table.element(a,round(mypacf[i],6))
mytstat <- mypacf[i]*sqrtn
a<-table.element(a,round(mytstat,4))
a<-table.element(a,round(1-pt(abs(mytstat),lengthx),6))
a<-table.row.end(a)
}
a<-table.end(a)
table.save(a,file='mytable1.tab')