Free Statistics

of Irreproducible Research!

Author's title

Author*The author of this computation has been verified*
R Software Modulerwasp_autocorrelation.wasp
Title produced by software(Partial) Autocorrelation Function
Date of computationTue, 18 Dec 2012 06:43:36 -0500
Cite this page as followsStatistical Computations at FreeStatistics.org, Office for Research Development and Education, URL https://freestatistics.org/blog/index.php?v=date/2012/Dec/18/t1355831031rpazygfvok79hvq.htm/, Retrieved Sat, 20 Apr 2024 02:55:49 +0000
Statistical Computations at FreeStatistics.org, Office for Research Development and Education, URL https://freestatistics.org/blog/index.php?pk=201387, Retrieved Sat, 20 Apr 2024 02:55:49 +0000
QR Codes:

Original text written by user:
IsPrivate?No (this computation is public)
User-defined keywords
Estimated Impact117
Family? (F = Feedback message, R = changed R code, M = changed R Module, P = changed Parameters, D = changed Data)
-       [(Partial) Autocorrelation Function] [autocorrelation f...] [2012-12-18 11:43:36] [239167cccea8953a8e1721fd6db07280] [Current]
Feedback Forum

Post a new message
Dataseries X:
4143
4429
5219
4929
5761
5592
4163
4962
5208
4755
4491
5732
5731
5040
6102
4904
5369
5578
4619
4731
5011
5299
4146
4625
4736
4219
5116
4205
4121
5103
4300
4578
3809
5657
4248
3830
4736
4839
4411
4570
4104
4801
3953
3828
4440
4026
4109
4785
3224
3552
3940
3913
3681
4309
3830
4143
4087
3818
3380
3430
3458
3970
5260
5024
5634
6549
4676


Summary of computational transaction
Raw Inputview raw input (R code)
Raw Outputview raw output of R engine
Computing time3 seconds
R Server'Sir Ronald Aylmer Fisher' @ fisher.wessa.net

\begin{tabular}{lllllllll}
\hline
Summary of computational transaction \tabularnewline
Raw Input & view raw input (R code)  \tabularnewline
Raw Output & view raw output of R engine  \tabularnewline
Computing time & 3 seconds \tabularnewline
R Server & 'Sir Ronald Aylmer Fisher' @ fisher.wessa.net \tabularnewline
\hline
\end{tabular}
%Source: https://freestatistics.org/blog/index.php?pk=201387&T=0

[TABLE]
[ROW][C]Summary of computational transaction[/C][/ROW]
[ROW][C]Raw Input[/C][C]view raw input (R code) [/C][/ROW]
[ROW][C]Raw Output[/C][C]view raw output of R engine [/C][/ROW]
[ROW][C]Computing time[/C][C]3 seconds[/C][/ROW]
[ROW][C]R Server[/C][C]'Sir Ronald Aylmer Fisher' @ fisher.wessa.net[/C][/ROW]
[/TABLE]
Source: https://freestatistics.org/blog/index.php?pk=201387&T=0

Globally Unique Identifier (entire table): ba.freestatistics.org/blog/index.php?pk=201387&T=0

As an alternative you can also use a QR Code:  

The GUIDs for individual cells are displayed in the table below:

Summary of computational transaction
Raw Inputview raw input (R code)
Raw Outputview raw output of R engine
Computing time3 seconds
R Server'Sir Ronald Aylmer Fisher' @ fisher.wessa.net


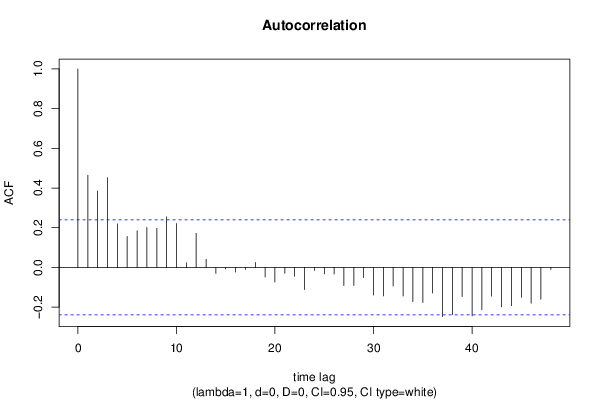
Autocorrelation Function
Time lag kACF(k)T-STATP-value
10.4640253.79820.000158
20.3851983.1530.001209
30.45193.6990.000219
40.2191821.79410.038656
50.1557741.27510.103345
60.1846021.5110.067741
70.2012471.64730.052091
80.1965961.60920.056136
90.254542.08350.020512
100.2211841.81050.037353
110.0229180.18760.425883
120.1716731.40520.08229
130.0408540.33440.36956
14-0.030198-0.24720.402763
15-0.007411-0.06070.475903
16-0.022898-0.18740.425946
17-0.010381-0.0850.466267
180.0245630.20110.420633
19-0.048559-0.39750.346141
20-0.073536-0.60190.27463
21-0.02952-0.24160.404902
22-0.044466-0.3640.358512
23-0.11141-0.91190.182539
24-0.016029-0.13120.448004
25-0.032557-0.26650.395341
26-0.033768-0.27640.391544
27-0.090922-0.74420.22967
28-0.091213-0.74660.228955
29-0.051396-0.42070.337662
30-0.139197-1.13940.129302
31-0.143724-1.17640.121792
32-0.094138-0.77060.22184
33-0.14393-1.17810.121458
34-0.172327-1.41060.081501
35-0.177195-1.45040.075806
36-0.12887-1.05490.147641
37-0.248191-2.03150.023085
38-0.23717-1.94130.028213
39-0.146773-1.20140.116914
40-0.24435-2.00010.024773
41-0.213133-1.74460.042823
42-0.144934-1.18630.119839
43-0.198745-1.62680.054237
44-0.192618-1.57660.059794
45-0.150441-1.23140.111237
46-0.180557-1.47790.072057
47-0.160219-1.31140.097092
48-0.010173-0.08330.466943

\begin{tabular}{lllllllll}
\hline
Autocorrelation Function \tabularnewline
Time lag k & ACF(k) & T-STAT & P-value \tabularnewline
1 & 0.464025 & 3.7982 & 0.000158 \tabularnewline
2 & 0.385198 & 3.153 & 0.001209 \tabularnewline
3 & 0.4519 & 3.699 & 0.000219 \tabularnewline
4 & 0.219182 & 1.7941 & 0.038656 \tabularnewline
5 & 0.155774 & 1.2751 & 0.103345 \tabularnewline
6 & 0.184602 & 1.511 & 0.067741 \tabularnewline
7 & 0.201247 & 1.6473 & 0.052091 \tabularnewline
8 & 0.196596 & 1.6092 & 0.056136 \tabularnewline
9 & 0.25454 & 2.0835 & 0.020512 \tabularnewline
10 & 0.221184 & 1.8105 & 0.037353 \tabularnewline
11 & 0.022918 & 0.1876 & 0.425883 \tabularnewline
12 & 0.171673 & 1.4052 & 0.08229 \tabularnewline
13 & 0.040854 & 0.3344 & 0.36956 \tabularnewline
14 & -0.030198 & -0.2472 & 0.402763 \tabularnewline
15 & -0.007411 & -0.0607 & 0.475903 \tabularnewline
16 & -0.022898 & -0.1874 & 0.425946 \tabularnewline
17 & -0.010381 & -0.085 & 0.466267 \tabularnewline
18 & 0.024563 & 0.2011 & 0.420633 \tabularnewline
19 & -0.048559 & -0.3975 & 0.346141 \tabularnewline
20 & -0.073536 & -0.6019 & 0.27463 \tabularnewline
21 & -0.02952 & -0.2416 & 0.404902 \tabularnewline
22 & -0.044466 & -0.364 & 0.358512 \tabularnewline
23 & -0.11141 & -0.9119 & 0.182539 \tabularnewline
24 & -0.016029 & -0.1312 & 0.448004 \tabularnewline
25 & -0.032557 & -0.2665 & 0.395341 \tabularnewline
26 & -0.033768 & -0.2764 & 0.391544 \tabularnewline
27 & -0.090922 & -0.7442 & 0.22967 \tabularnewline
28 & -0.091213 & -0.7466 & 0.228955 \tabularnewline
29 & -0.051396 & -0.4207 & 0.337662 \tabularnewline
30 & -0.139197 & -1.1394 & 0.129302 \tabularnewline
31 & -0.143724 & -1.1764 & 0.121792 \tabularnewline
32 & -0.094138 & -0.7706 & 0.22184 \tabularnewline
33 & -0.14393 & -1.1781 & 0.121458 \tabularnewline
34 & -0.172327 & -1.4106 & 0.081501 \tabularnewline
35 & -0.177195 & -1.4504 & 0.075806 \tabularnewline
36 & -0.12887 & -1.0549 & 0.147641 \tabularnewline
37 & -0.248191 & -2.0315 & 0.023085 \tabularnewline
38 & -0.23717 & -1.9413 & 0.028213 \tabularnewline
39 & -0.146773 & -1.2014 & 0.116914 \tabularnewline
40 & -0.24435 & -2.0001 & 0.024773 \tabularnewline
41 & -0.213133 & -1.7446 & 0.042823 \tabularnewline
42 & -0.144934 & -1.1863 & 0.119839 \tabularnewline
43 & -0.198745 & -1.6268 & 0.054237 \tabularnewline
44 & -0.192618 & -1.5766 & 0.059794 \tabularnewline
45 & -0.150441 & -1.2314 & 0.111237 \tabularnewline
46 & -0.180557 & -1.4779 & 0.072057 \tabularnewline
47 & -0.160219 & -1.3114 & 0.097092 \tabularnewline
48 & -0.010173 & -0.0833 & 0.466943 \tabularnewline
\hline
\end{tabular}
%Source: https://freestatistics.org/blog/index.php?pk=201387&T=1

[TABLE]
[ROW][C]Autocorrelation Function[/C][/ROW]
[ROW][C]Time lag k[/C][C]ACF(k)[/C][C]T-STAT[/C][C]P-value[/C][/ROW]
[ROW][C]1[/C][C]0.464025[/C][C]3.7982[/C][C]0.000158[/C][/ROW]
[ROW][C]2[/C][C]0.385198[/C][C]3.153[/C][C]0.001209[/C][/ROW]
[ROW][C]3[/C][C]0.4519[/C][C]3.699[/C][C]0.000219[/C][/ROW]
[ROW][C]4[/C][C]0.219182[/C][C]1.7941[/C][C]0.038656[/C][/ROW]
[ROW][C]5[/C][C]0.155774[/C][C]1.2751[/C][C]0.103345[/C][/ROW]
[ROW][C]6[/C][C]0.184602[/C][C]1.511[/C][C]0.067741[/C][/ROW]
[ROW][C]7[/C][C]0.201247[/C][C]1.6473[/C][C]0.052091[/C][/ROW]
[ROW][C]8[/C][C]0.196596[/C][C]1.6092[/C][C]0.056136[/C][/ROW]
[ROW][C]9[/C][C]0.25454[/C][C]2.0835[/C][C]0.020512[/C][/ROW]
[ROW][C]10[/C][C]0.221184[/C][C]1.8105[/C][C]0.037353[/C][/ROW]
[ROW][C]11[/C][C]0.022918[/C][C]0.1876[/C][C]0.425883[/C][/ROW]
[ROW][C]12[/C][C]0.171673[/C][C]1.4052[/C][C]0.08229[/C][/ROW]
[ROW][C]13[/C][C]0.040854[/C][C]0.3344[/C][C]0.36956[/C][/ROW]
[ROW][C]14[/C][C]-0.030198[/C][C]-0.2472[/C][C]0.402763[/C][/ROW]
[ROW][C]15[/C][C]-0.007411[/C][C]-0.0607[/C][C]0.475903[/C][/ROW]
[ROW][C]16[/C][C]-0.022898[/C][C]-0.1874[/C][C]0.425946[/C][/ROW]
[ROW][C]17[/C][C]-0.010381[/C][C]-0.085[/C][C]0.466267[/C][/ROW]
[ROW][C]18[/C][C]0.024563[/C][C]0.2011[/C][C]0.420633[/C][/ROW]
[ROW][C]19[/C][C]-0.048559[/C][C]-0.3975[/C][C]0.346141[/C][/ROW]
[ROW][C]20[/C][C]-0.073536[/C][C]-0.6019[/C][C]0.27463[/C][/ROW]
[ROW][C]21[/C][C]-0.02952[/C][C]-0.2416[/C][C]0.404902[/C][/ROW]
[ROW][C]22[/C][C]-0.044466[/C][C]-0.364[/C][C]0.358512[/C][/ROW]
[ROW][C]23[/C][C]-0.11141[/C][C]-0.9119[/C][C]0.182539[/C][/ROW]
[ROW][C]24[/C][C]-0.016029[/C][C]-0.1312[/C][C]0.448004[/C][/ROW]
[ROW][C]25[/C][C]-0.032557[/C][C]-0.2665[/C][C]0.395341[/C][/ROW]
[ROW][C]26[/C][C]-0.033768[/C][C]-0.2764[/C][C]0.391544[/C][/ROW]
[ROW][C]27[/C][C]-0.090922[/C][C]-0.7442[/C][C]0.22967[/C][/ROW]
[ROW][C]28[/C][C]-0.091213[/C][C]-0.7466[/C][C]0.228955[/C][/ROW]
[ROW][C]29[/C][C]-0.051396[/C][C]-0.4207[/C][C]0.337662[/C][/ROW]
[ROW][C]30[/C][C]-0.139197[/C][C]-1.1394[/C][C]0.129302[/C][/ROW]
[ROW][C]31[/C][C]-0.143724[/C][C]-1.1764[/C][C]0.121792[/C][/ROW]
[ROW][C]32[/C][C]-0.094138[/C][C]-0.7706[/C][C]0.22184[/C][/ROW]
[ROW][C]33[/C][C]-0.14393[/C][C]-1.1781[/C][C]0.121458[/C][/ROW]
[ROW][C]34[/C][C]-0.172327[/C][C]-1.4106[/C][C]0.081501[/C][/ROW]
[ROW][C]35[/C][C]-0.177195[/C][C]-1.4504[/C][C]0.075806[/C][/ROW]
[ROW][C]36[/C][C]-0.12887[/C][C]-1.0549[/C][C]0.147641[/C][/ROW]
[ROW][C]37[/C][C]-0.248191[/C][C]-2.0315[/C][C]0.023085[/C][/ROW]
[ROW][C]38[/C][C]-0.23717[/C][C]-1.9413[/C][C]0.028213[/C][/ROW]
[ROW][C]39[/C][C]-0.146773[/C][C]-1.2014[/C][C]0.116914[/C][/ROW]
[ROW][C]40[/C][C]-0.24435[/C][C]-2.0001[/C][C]0.024773[/C][/ROW]
[ROW][C]41[/C][C]-0.213133[/C][C]-1.7446[/C][C]0.042823[/C][/ROW]
[ROW][C]42[/C][C]-0.144934[/C][C]-1.1863[/C][C]0.119839[/C][/ROW]
[ROW][C]43[/C][C]-0.198745[/C][C]-1.6268[/C][C]0.054237[/C][/ROW]
[ROW][C]44[/C][C]-0.192618[/C][C]-1.5766[/C][C]0.059794[/C][/ROW]
[ROW][C]45[/C][C]-0.150441[/C][C]-1.2314[/C][C]0.111237[/C][/ROW]
[ROW][C]46[/C][C]-0.180557[/C][C]-1.4779[/C][C]0.072057[/C][/ROW]
[ROW][C]47[/C][C]-0.160219[/C][C]-1.3114[/C][C]0.097092[/C][/ROW]
[ROW][C]48[/C][C]-0.010173[/C][C]-0.0833[/C][C]0.466943[/C][/ROW]
[/TABLE]
Source: https://freestatistics.org/blog/index.php?pk=201387&T=1

Globally Unique Identifier (entire table): ba.freestatistics.org/blog/index.php?pk=201387&T=1

As an alternative you can also use a QR Code:  

The GUIDs for individual cells are displayed in the table below:

Autocorrelation Function
Time lag kACF(k)T-STATP-value
10.4640253.79820.000158
20.3851983.1530.001209
30.45193.6990.000219
40.2191821.79410.038656
50.1557741.27510.103345
60.1846021.5110.067741
70.2012471.64730.052091
80.1965961.60920.056136
90.254542.08350.020512
100.2211841.81050.037353
110.0229180.18760.425883
120.1716731.40520.08229
130.0408540.33440.36956
14-0.030198-0.24720.402763
15-0.007411-0.06070.475903
16-0.022898-0.18740.425946
17-0.010381-0.0850.466267
180.0245630.20110.420633
19-0.048559-0.39750.346141
20-0.073536-0.60190.27463
21-0.02952-0.24160.404902
22-0.044466-0.3640.358512
23-0.11141-0.91190.182539
24-0.016029-0.13120.448004
25-0.032557-0.26650.395341
26-0.033768-0.27640.391544
27-0.090922-0.74420.22967
28-0.091213-0.74660.228955
29-0.051396-0.42070.337662
30-0.139197-1.13940.129302
31-0.143724-1.17640.121792
32-0.094138-0.77060.22184
33-0.14393-1.17810.121458
34-0.172327-1.41060.081501
35-0.177195-1.45040.075806
36-0.12887-1.05490.147641
37-0.248191-2.03150.023085
38-0.23717-1.94130.028213
39-0.146773-1.20140.116914
40-0.24435-2.00010.024773
41-0.213133-1.74460.042823
42-0.144934-1.18630.119839
43-0.198745-1.62680.054237
44-0.192618-1.57660.059794
45-0.150441-1.23140.111237
46-0.180557-1.47790.072057
47-0.160219-1.31140.097092
48-0.010173-0.08330.466943


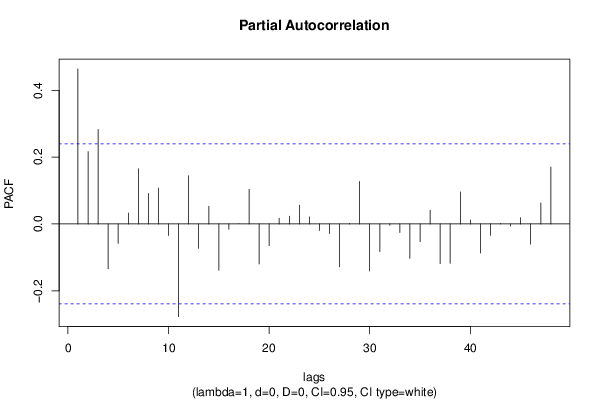
Partial Autocorrelation Function
Time lag kPACF(k)T-STATP-value
10.4640253.79820.000158
20.2164941.77210.040464
30.2826532.31360.011883
4-0.134313-1.09940.137765
5-0.058184-0.47630.31772
60.0327240.26790.394816
70.1651891.35210.09044
80.0911970.74650.228994
90.1072770.87810.191514
10-0.034426-0.28180.389486
11-0.277455-2.27110.013181
120.1441151.17960.121159
13-0.073212-0.59930.275507
140.0529680.43360.332999
15-0.138692-1.13520.13016
16-0.015639-0.1280.449262
176e-055e-040.499806
180.1035390.84750.199865
19-0.119653-0.97940.165452
20-0.064903-0.53130.2985
210.0170170.13930.444819
220.0230640.18880.425416
230.0562010.460.323495
240.0212350.17380.431269
25-0.019401-0.15880.437149
26-0.028712-0.2350.407457
27-0.127942-1.04730.149373
280.0014740.01210.495205
290.1271511.04080.15086
30-0.140663-1.15140.126834
31-0.082322-0.67380.251367
32-0.004118-0.03370.486605
33-0.025816-0.21130.416641
34-0.102928-0.84250.201253
35-0.052993-0.43380.332926
360.0410440.3360.368975
37-0.118671-0.97140.16743
38-0.117738-0.96370.169325
390.0959370.78530.217528
400.0116830.09560.462052
41-0.087155-0.71340.239041
42-0.034094-0.27910.390524
430.0004330.00350.49859
44-0.005991-0.0490.480516
450.0187940.15380.439101
46-0.060492-0.49520.311057
470.0625690.51220.305114
480.1702051.39320.084085

\begin{tabular}{lllllllll}
\hline
Partial Autocorrelation Function \tabularnewline
Time lag k & PACF(k) & T-STAT & P-value \tabularnewline
1 & 0.464025 & 3.7982 & 0.000158 \tabularnewline
2 & 0.216494 & 1.7721 & 0.040464 \tabularnewline
3 & 0.282653 & 2.3136 & 0.011883 \tabularnewline
4 & -0.134313 & -1.0994 & 0.137765 \tabularnewline
5 & -0.058184 & -0.4763 & 0.31772 \tabularnewline
6 & 0.032724 & 0.2679 & 0.394816 \tabularnewline
7 & 0.165189 & 1.3521 & 0.09044 \tabularnewline
8 & 0.091197 & 0.7465 & 0.228994 \tabularnewline
9 & 0.107277 & 0.8781 & 0.191514 \tabularnewline
10 & -0.034426 & -0.2818 & 0.389486 \tabularnewline
11 & -0.277455 & -2.2711 & 0.013181 \tabularnewline
12 & 0.144115 & 1.1796 & 0.121159 \tabularnewline
13 & -0.073212 & -0.5993 & 0.275507 \tabularnewline
14 & 0.052968 & 0.4336 & 0.332999 \tabularnewline
15 & -0.138692 & -1.1352 & 0.13016 \tabularnewline
16 & -0.015639 & -0.128 & 0.449262 \tabularnewline
17 & 6e-05 & 5e-04 & 0.499806 \tabularnewline
18 & 0.103539 & 0.8475 & 0.199865 \tabularnewline
19 & -0.119653 & -0.9794 & 0.165452 \tabularnewline
20 & -0.064903 & -0.5313 & 0.2985 \tabularnewline
21 & 0.017017 & 0.1393 & 0.444819 \tabularnewline
22 & 0.023064 & 0.1888 & 0.425416 \tabularnewline
23 & 0.056201 & 0.46 & 0.323495 \tabularnewline
24 & 0.021235 & 0.1738 & 0.431269 \tabularnewline
25 & -0.019401 & -0.1588 & 0.437149 \tabularnewline
26 & -0.028712 & -0.235 & 0.407457 \tabularnewline
27 & -0.127942 & -1.0473 & 0.149373 \tabularnewline
28 & 0.001474 & 0.0121 & 0.495205 \tabularnewline
29 & 0.127151 & 1.0408 & 0.15086 \tabularnewline
30 & -0.140663 & -1.1514 & 0.126834 \tabularnewline
31 & -0.082322 & -0.6738 & 0.251367 \tabularnewline
32 & -0.004118 & -0.0337 & 0.486605 \tabularnewline
33 & -0.025816 & -0.2113 & 0.416641 \tabularnewline
34 & -0.102928 & -0.8425 & 0.201253 \tabularnewline
35 & -0.052993 & -0.4338 & 0.332926 \tabularnewline
36 & 0.041044 & 0.336 & 0.368975 \tabularnewline
37 & -0.118671 & -0.9714 & 0.16743 \tabularnewline
38 & -0.117738 & -0.9637 & 0.169325 \tabularnewline
39 & 0.095937 & 0.7853 & 0.217528 \tabularnewline
40 & 0.011683 & 0.0956 & 0.462052 \tabularnewline
41 & -0.087155 & -0.7134 & 0.239041 \tabularnewline
42 & -0.034094 & -0.2791 & 0.390524 \tabularnewline
43 & 0.000433 & 0.0035 & 0.49859 \tabularnewline
44 & -0.005991 & -0.049 & 0.480516 \tabularnewline
45 & 0.018794 & 0.1538 & 0.439101 \tabularnewline
46 & -0.060492 & -0.4952 & 0.311057 \tabularnewline
47 & 0.062569 & 0.5122 & 0.305114 \tabularnewline
48 & 0.170205 & 1.3932 & 0.084085 \tabularnewline
\hline
\end{tabular}
%Source: https://freestatistics.org/blog/index.php?pk=201387&T=2

[TABLE]
[ROW][C]Partial Autocorrelation Function[/C][/ROW]
[ROW][C]Time lag k[/C][C]PACF(k)[/C][C]T-STAT[/C][C]P-value[/C][/ROW]
[ROW][C]1[/C][C]0.464025[/C][C]3.7982[/C][C]0.000158[/C][/ROW]
[ROW][C]2[/C][C]0.216494[/C][C]1.7721[/C][C]0.040464[/C][/ROW]
[ROW][C]3[/C][C]0.282653[/C][C]2.3136[/C][C]0.011883[/C][/ROW]
[ROW][C]4[/C][C]-0.134313[/C][C]-1.0994[/C][C]0.137765[/C][/ROW]
[ROW][C]5[/C][C]-0.058184[/C][C]-0.4763[/C][C]0.31772[/C][/ROW]
[ROW][C]6[/C][C]0.032724[/C][C]0.2679[/C][C]0.394816[/C][/ROW]
[ROW][C]7[/C][C]0.165189[/C][C]1.3521[/C][C]0.09044[/C][/ROW]
[ROW][C]8[/C][C]0.091197[/C][C]0.7465[/C][C]0.228994[/C][/ROW]
[ROW][C]9[/C][C]0.107277[/C][C]0.8781[/C][C]0.191514[/C][/ROW]
[ROW][C]10[/C][C]-0.034426[/C][C]-0.2818[/C][C]0.389486[/C][/ROW]
[ROW][C]11[/C][C]-0.277455[/C][C]-2.2711[/C][C]0.013181[/C][/ROW]
[ROW][C]12[/C][C]0.144115[/C][C]1.1796[/C][C]0.121159[/C][/ROW]
[ROW][C]13[/C][C]-0.073212[/C][C]-0.5993[/C][C]0.275507[/C][/ROW]
[ROW][C]14[/C][C]0.052968[/C][C]0.4336[/C][C]0.332999[/C][/ROW]
[ROW][C]15[/C][C]-0.138692[/C][C]-1.1352[/C][C]0.13016[/C][/ROW]
[ROW][C]16[/C][C]-0.015639[/C][C]-0.128[/C][C]0.449262[/C][/ROW]
[ROW][C]17[/C][C]6e-05[/C][C]5e-04[/C][C]0.499806[/C][/ROW]
[ROW][C]18[/C][C]0.103539[/C][C]0.8475[/C][C]0.199865[/C][/ROW]
[ROW][C]19[/C][C]-0.119653[/C][C]-0.9794[/C][C]0.165452[/C][/ROW]
[ROW][C]20[/C][C]-0.064903[/C][C]-0.5313[/C][C]0.2985[/C][/ROW]
[ROW][C]21[/C][C]0.017017[/C][C]0.1393[/C][C]0.444819[/C][/ROW]
[ROW][C]22[/C][C]0.023064[/C][C]0.1888[/C][C]0.425416[/C][/ROW]
[ROW][C]23[/C][C]0.056201[/C][C]0.46[/C][C]0.323495[/C][/ROW]
[ROW][C]24[/C][C]0.021235[/C][C]0.1738[/C][C]0.431269[/C][/ROW]
[ROW][C]25[/C][C]-0.019401[/C][C]-0.1588[/C][C]0.437149[/C][/ROW]
[ROW][C]26[/C][C]-0.028712[/C][C]-0.235[/C][C]0.407457[/C][/ROW]
[ROW][C]27[/C][C]-0.127942[/C][C]-1.0473[/C][C]0.149373[/C][/ROW]
[ROW][C]28[/C][C]0.001474[/C][C]0.0121[/C][C]0.495205[/C][/ROW]
[ROW][C]29[/C][C]0.127151[/C][C]1.0408[/C][C]0.15086[/C][/ROW]
[ROW][C]30[/C][C]-0.140663[/C][C]-1.1514[/C][C]0.126834[/C][/ROW]
[ROW][C]31[/C][C]-0.082322[/C][C]-0.6738[/C][C]0.251367[/C][/ROW]
[ROW][C]32[/C][C]-0.004118[/C][C]-0.0337[/C][C]0.486605[/C][/ROW]
[ROW][C]33[/C][C]-0.025816[/C][C]-0.2113[/C][C]0.416641[/C][/ROW]
[ROW][C]34[/C][C]-0.102928[/C][C]-0.8425[/C][C]0.201253[/C][/ROW]
[ROW][C]35[/C][C]-0.052993[/C][C]-0.4338[/C][C]0.332926[/C][/ROW]
[ROW][C]36[/C][C]0.041044[/C][C]0.336[/C][C]0.368975[/C][/ROW]
[ROW][C]37[/C][C]-0.118671[/C][C]-0.9714[/C][C]0.16743[/C][/ROW]
[ROW][C]38[/C][C]-0.117738[/C][C]-0.9637[/C][C]0.169325[/C][/ROW]
[ROW][C]39[/C][C]0.095937[/C][C]0.7853[/C][C]0.217528[/C][/ROW]
[ROW][C]40[/C][C]0.011683[/C][C]0.0956[/C][C]0.462052[/C][/ROW]
[ROW][C]41[/C][C]-0.087155[/C][C]-0.7134[/C][C]0.239041[/C][/ROW]
[ROW][C]42[/C][C]-0.034094[/C][C]-0.2791[/C][C]0.390524[/C][/ROW]
[ROW][C]43[/C][C]0.000433[/C][C]0.0035[/C][C]0.49859[/C][/ROW]
[ROW][C]44[/C][C]-0.005991[/C][C]-0.049[/C][C]0.480516[/C][/ROW]
[ROW][C]45[/C][C]0.018794[/C][C]0.1538[/C][C]0.439101[/C][/ROW]
[ROW][C]46[/C][C]-0.060492[/C][C]-0.4952[/C][C]0.311057[/C][/ROW]
[ROW][C]47[/C][C]0.062569[/C][C]0.5122[/C][C]0.305114[/C][/ROW]
[ROW][C]48[/C][C]0.170205[/C][C]1.3932[/C][C]0.084085[/C][/ROW]
[/TABLE]
Source: https://freestatistics.org/blog/index.php?pk=201387&T=2

Globally Unique Identifier (entire table): ba.freestatistics.org/blog/index.php?pk=201387&T=2

As an alternative you can also use a QR Code:  

The GUIDs for individual cells are displayed in the table below:

Partial Autocorrelation Function
Time lag kPACF(k)T-STATP-value
10.4640253.79820.000158
20.2164941.77210.040464
30.2826532.31360.011883
4-0.134313-1.09940.137765
5-0.058184-0.47630.31772
60.0327240.26790.394816
70.1651891.35210.09044
80.0911970.74650.228994
90.1072770.87810.191514
10-0.034426-0.28180.389486
11-0.277455-2.27110.013181
120.1441151.17960.121159
13-0.073212-0.59930.275507
140.0529680.43360.332999
15-0.138692-1.13520.13016
16-0.015639-0.1280.449262
176e-055e-040.499806
180.1035390.84750.199865
19-0.119653-0.97940.165452
20-0.064903-0.53130.2985
210.0170170.13930.444819
220.0230640.18880.425416
230.0562010.460.323495
240.0212350.17380.431269
25-0.019401-0.15880.437149
26-0.028712-0.2350.407457
27-0.127942-1.04730.149373
280.0014740.01210.495205
290.1271511.04080.15086
30-0.140663-1.15140.126834
31-0.082322-0.67380.251367
32-0.004118-0.03370.486605
33-0.025816-0.21130.416641
34-0.102928-0.84250.201253
35-0.052993-0.43380.332926
360.0410440.3360.368975
37-0.118671-0.97140.16743
38-0.117738-0.96370.169325
390.0959370.78530.217528
400.0116830.09560.462052
41-0.087155-0.71340.239041
42-0.034094-0.27910.390524
430.0004330.00350.49859
44-0.005991-0.0490.480516
450.0187940.15380.439101
46-0.060492-0.49520.311057
470.0625690.51220.305114
480.1702051.39320.084085


Parameters (Session):
par1 = 48 ; par2 = 1 ; par3 = 0 ; par4 = 0 ; par5 = 12 ; par6 = White Noise ; par7 = 0.95 ;
Parameters (R input):
par1 = 48 ; par2 = 1 ; par3 = 0 ; par4 = 0 ; par5 = 12 ; par6 = White Noise ; par7 = 0.95 ; par8 = ;
R code (references can be found in the software module):
if (par1 == 'Default') {
par1 = 10*log10(length(x))
} else {
par1 <- as.numeric(par1)
}
par2 <- as.numeric(par2)
par3 <- as.numeric(par3)
par4 <- as.numeric(par4)
par5 <- as.numeric(par5)
if (par6 == 'White Noise') par6 <- 'white' else par6 <- 'ma'
par7 <- as.numeric(par7)
if (par8 != '') par8 <- as.numeric(par8)
ox <- x
if (par8 == '') {
if (par2 == 0) {
x <- log(x)
} else {
x <- (x ^ par2 - 1) / par2
}
} else {
x <- log(x,base=par8)
}
if (par3 > 0) x <- diff(x,lag=1,difference=par3)
if (par4 > 0) x <- diff(x,lag=par5,difference=par4)
bitmap(file='picts.png')
op <- par(mfrow=c(2,1))
plot(ox,type='l',main='Original Time Series',xlab='time',ylab='value')
if (par8=='') {
mytitle <- paste('Working Time Series (lambda=',par2,', d=',par3,', D=',par4,')',sep='')
mysub <- paste('(lambda=',par2,', d=',par3,', D=',par4,', CI=', par7, ', CI type=',par6,')',sep='')
} else {
mytitle <- paste('Working Time Series (base=',par8,', d=',par3,', D=',par4,')',sep='')
mysub <- paste('(base=',par8,', d=',par3,', D=',par4,', CI=', par7, ', CI type=',par6,')',sep='')
}
plot(x,type='l', main=mytitle,xlab='time',ylab='value')
par(op)
dev.off()
bitmap(file='pic1.png')
racf <- acf(x, par1, main='Autocorrelation', xlab='time lag', ylab='ACF', ci.type=par6, ci=par7, sub=mysub)
dev.off()
bitmap(file='pic2.png')
rpacf <- pacf(x,par1,main='Partial Autocorrelation',xlab='lags',ylab='PACF',sub=mysub)
dev.off()
(myacf <- c(racf$acf))
(mypacf <- c(rpacf$acf))
lengthx <- length(x)
sqrtn <- sqrt(lengthx)
load(file='createtable')
a<-table.start()
a<-table.row.start(a)
a<-table.element(a,'Autocorrelation Function',4,TRUE)
a<-table.row.end(a)
a<-table.row.start(a)
a<-table.element(a,'Time lag k',header=TRUE)
a<-table.element(a,hyperlink('basics.htm','ACF(k)','click here for more information about the Autocorrelation Function'),header=TRUE)
a<-table.element(a,'T-STAT',header=TRUE)
a<-table.element(a,'P-value',header=TRUE)
a<-table.row.end(a)
for (i in 2:(par1+1)) {
a<-table.row.start(a)
a<-table.element(a,i-1,header=TRUE)
a<-table.element(a,round(myacf[i],6))
mytstat <- myacf[i]*sqrtn
a<-table.element(a,round(mytstat,4))
a<-table.element(a,round(1-pt(abs(mytstat),lengthx),6))
a<-table.row.end(a)
}
a<-table.end(a)
table.save(a,file='mytable.tab')
a<-table.start()
a<-table.row.start(a)
a<-table.element(a,'Partial Autocorrelation Function',4,TRUE)
a<-table.row.end(a)
a<-table.row.start(a)
a<-table.element(a,'Time lag k',header=TRUE)
a<-table.element(a,hyperlink('basics.htm','PACF(k)','click here for more information about the Partial Autocorrelation Function'),header=TRUE)
a<-table.element(a,'T-STAT',header=TRUE)
a<-table.element(a,'P-value',header=TRUE)
a<-table.row.end(a)
for (i in 1:par1) {
a<-table.row.start(a)
a<-table.element(a,i,header=TRUE)
a<-table.element(a,round(mypacf[i],6))
mytstat <- mypacf[i]*sqrtn
a<-table.element(a,round(mytstat,4))
a<-table.element(a,round(1-pt(abs(mytstat),lengthx),6))
a<-table.row.end(a)
}
a<-table.end(a)
table.save(a,file='mytable1.tab')