| Tabulation of Results | ||
| Used x Useful | ||
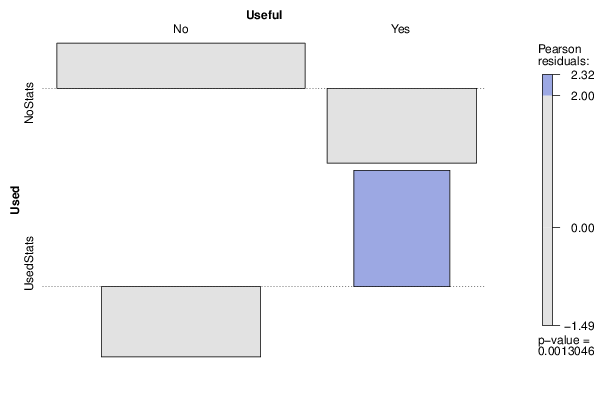
| No | Yes | NoStats | 88 | 21 | UsedStats | 25 | 20 |
| Tabulation of Expected Results | ||
| Used x Useful | ||
| No | Yes | NoStats | 79.98 | 29.02 | UsedStats | 33.02 | 11.98 |
| Statistical Results | |
| Pearson's Chi-squared test with Yates' continuity correction | |
| Pearson Chi Square Statistic | 9.09 |
| Degrees of Freedom | 1 |
| P value | 0 |