| Tabulation of Results | ||
| pre x post | ||
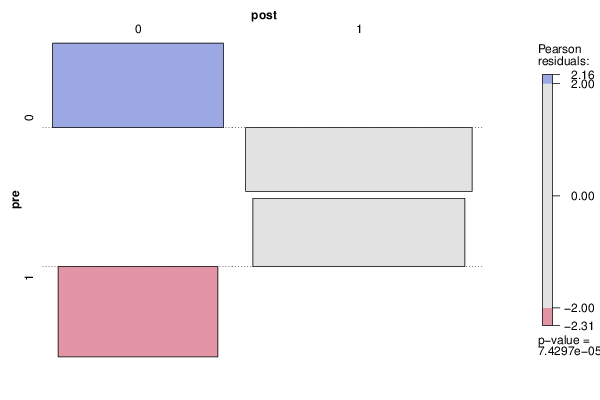
| 0 | 1 | 0 | 30 | 26 | 1 | 8 | 41 |
| Tabulation of Expected Results | ||
| pre x post | ||
| 0 | 1 | 0 | 20.27 | 35.73 | 1 | 17.73 | 31.27 |
| Statistical Results | |
| Pearson's Chi-squared test with simulated p-value (based on 2000 replicates) | |
| Exact Pearson Chi Square Statistic | 15.7 |
| P value | 0 |