| Tabulation of Results | ||
| Used x Outcome | ||
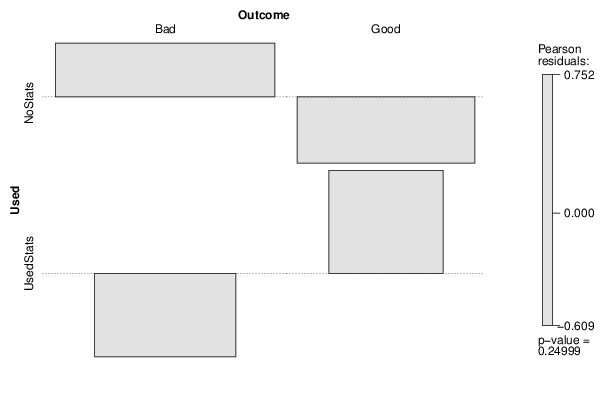
| Bad | Good | NoStats | 69 | 40 | UsedStats | 24 | 21 |
| Tabulation of Expected Results | ||
| Used x Outcome | ||
| Bad | Good | NoStats | 65.82 | 43.18 | UsedStats | 27.18 | 17.82 |
| Statistical Results | |
| Pearson's Chi-squared test with Yates' continuity correction | |
| Pearson Chi Square Statistic | 0.94 |
| Degrees of Freedom | 1 |
| P value | 0.33 |