Free Statistics
of Irreproducible Research!
Description of Statistical Computation | |||||||||||||||||||||||||||||||||||||||
|---|---|---|---|---|---|---|---|---|---|---|---|---|---|---|---|---|---|---|---|---|---|---|---|---|---|---|---|---|---|---|---|---|---|---|---|---|---|---|---|
| Author's title | |||||||||||||||||||||||||||||||||||||||
| Author | *The author of this computation has been verified* | ||||||||||||||||||||||||||||||||||||||
| R Software Module | rwasp_fitdistrnorm.wasp | ||||||||||||||||||||||||||||||||||||||
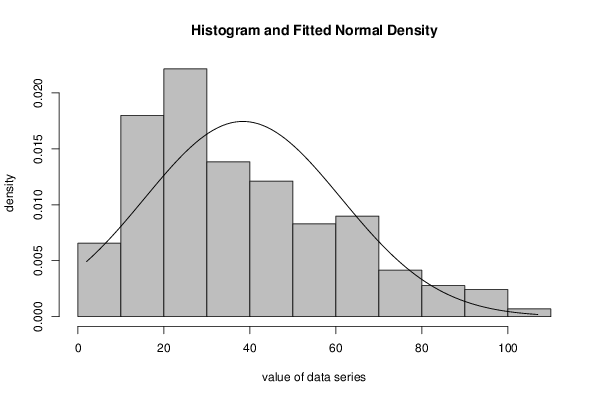
| Title produced by software | Maximum-likelihood Fitting - Normal Distribution | ||||||||||||||||||||||||||||||||||||||
| Date of computation | Mon, 17 Dec 2012 07:57:56 -0500 | ||||||||||||||||||||||||||||||||||||||
| Cite this page as follows | Statistical Computations at FreeStatistics.org, Office for Research Development and Education, URL https://freestatistics.org/blog/index.php?v=date/2012/Dec/17/t135574908988un4f6cypvotp3.htm/, Retrieved Thu, 25 Apr 2024 12:33:00 +0000 | ||||||||||||||||||||||||||||||||||||||
| Statistical Computations at FreeStatistics.org, Office for Research Development and Education, URL https://freestatistics.org/blog/index.php?pk=200827, Retrieved Thu, 25 Apr 2024 12:33:00 +0000 | |||||||||||||||||||||||||||||||||||||||
| QR Codes: | |||||||||||||||||||||||||||||||||||||||
|
| |||||||||||||||||||||||||||||||||||||||
| Original text written by user: | |||||||||||||||||||||||||||||||||||||||
| IsPrivate? | No (this computation is public) | ||||||||||||||||||||||||||||||||||||||
| User-defined keywords | |||||||||||||||||||||||||||||||||||||||
| Estimated Impact | 74 | ||||||||||||||||||||||||||||||||||||||
Tree of Dependent Computations | |||||||||||||||||||||||||||||||||||||||
| Family? (F = Feedback message, R = changed R code, M = changed R Module, P = changed Parameters, D = changed Data) | |||||||||||||||||||||||||||||||||||||||
| - [Maximum-likelihood Fitting - Normal Distribution] [Histogram _ likel...] [2012-11-19 14:47:15] [9f6ab6bc6461b94fa20254844eaa346d] - R [Maximum-likelihood Fitting - Normal Distribution] [] [2012-12-17 12:57:56] [b92b04f804c749591cd7453f92c6faff] [Current] | |||||||||||||||||||||||||||||||||||||||
| Feedback Forum | |||||||||||||||||||||||||||||||||||||||
Post a new message | |||||||||||||||||||||||||||||||||||||||
Dataset | |||||||||||||||||||||||||||||||||||||||
| Dataseries X: | |||||||||||||||||||||||||||||||||||||||
107 101 98 98 96 96 95 91 91 90 90 90 88 87 86 83 82 80 77 77 76 76 75 74 74 72 72 71 71 70 69 68 68 68 68 68 67 66 66 66 65 65 65 64 64 64 63 63 62 62 62 62 61 61 61 60 60 59 59 58 58 57 57 57 56 56 55 55 54 54 54 52 52 51 51 51 51 51 51 50 50 50 50 49 49 49 49 48 48 48 48 48 47 47 47 47 46 46 46 45 44 44 43 43 42 42 42 42 42 42 42 41 41 41 40 40 40 40 39 39 39 39 38 38 38 38 38 38 37 37 37 37 37 37 37 36 36 36 35 35 34 34 34 34 34 33 33 33 33 33 32 32 31 31 30 30 30 29 29 29 29 29 28 28 28 28 28 28 28 28 28 28 28 28 27 27 27 27 27 26 26 26 26 26 25 25 25 25 25 24 24 24 24 24 24 24 24 24 23 23 23 23 23 23 23 22 22 22 22 22 22 22 21 21 21 21 21 21 20 20 20 20 20 20 20 20 19 19 18 18 18 18 18 18 18 17 17 17 17 17 17 17 16 16 16 16 16 16 15 15 15 15 15 14 14 14 14 14 14 13 13 13 12 12 12 12 11 11 11 11 10 10 9 9 9 9 9 9 8 7 6 6 6 5 5 5 4 2 2 | |||||||||||||||||||||||||||||||||||||||
Tables (Output of Computation) | |||||||||||||||||||||||||||||||||||||||
| |||||||||||||||||||||||||||||||||||||||
Figures (Output of Computation) | |||||||||||||||||||||||||||||||||||||||
Input Parameters & R Code | |||||||||||||||||||||||||||||||||||||||
| Parameters (Session): | |||||||||||||||||||||||||||||||||||||||
| par1 = 8 ; par2 = 0 ; | |||||||||||||||||||||||||||||||||||||||
| Parameters (R input): | |||||||||||||||||||||||||||||||||||||||
| par1 = 8 ; par2 = 0 ; | |||||||||||||||||||||||||||||||||||||||
| R code (references can be found in the software module): | |||||||||||||||||||||||||||||||||||||||
library(MASS) | |||||||||||||||||||||||||||||||||||||||