| Tabulation of Results | ||
| Weeks x Outcome | ||
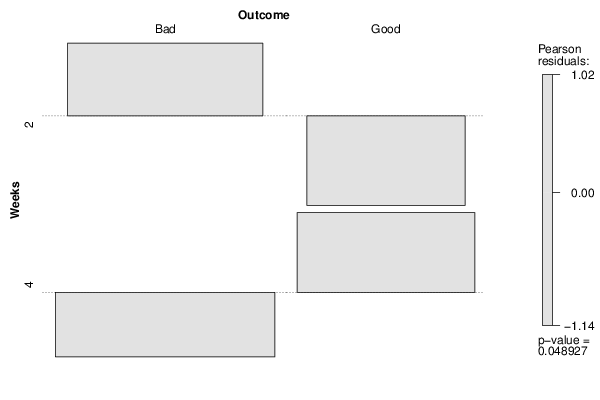
| Bad | Good | 2 | 47 | 21 | 4 | 46 | 40 |
| Tabulation of Expected Results | ||
| Weeks x Outcome | ||
| Bad | Good | 2 | 41.06 | 26.94 | 4 | 51.94 | 34.06 |
| Statistical Results | |
| Pearson's Chi-squared test with simulated p-value (based on 2000 replicates) | |
| Exact Pearson Chi Square Statistic | 3.88 |
| P value | 0.07 |