| Tabulation of Results | ||
| T40&T20 x Outcome | ||
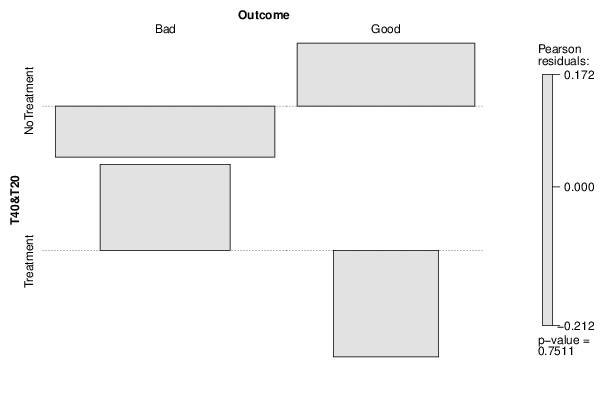
| Bad | Good | NoTreatment | 68 | 46 | Treatment | 25 | 15 |
| Tabulation of Expected Results | ||
| T40&T20 x Outcome | ||
| Bad | Good | NoTreatment | 68.84 | 45.16 | Treatment | 24.16 | 15.84 |
| Statistical Results | |
| Pearson's Chi-squared test with simulated p-value (based on 2000 replicates) | |
| Exact Pearson Chi Square Statistic | 0.1 |
| P value | 0.85 |