Free Statistics

of Irreproducible Research!

Author's title

Author*The author of this computation has been verified*
R Software Modulerwasp_arimaforecasting.wasp
Title produced by softwareARIMA Forecasting
Date of computationSun, 16 Dec 2012 17:00:53 -0500
Cite this page as followsStatistical Computations at FreeStatistics.org, Office for Research Development and Education, URL https://freestatistics.org/blog/index.php?v=date/2012/Dec/16/t135569531906866c90h64hmca.htm/, Retrieved Sat, 27 Apr 2024 00:25:17 +0000
Statistical Computations at FreeStatistics.org, Office for Research Development and Education, URL https://freestatistics.org/blog/index.php?pk=200629, Retrieved Sat, 27 Apr 2024 00:25:17 +0000
QR Codes:

Original text written by user:
IsPrivate?No (this computation is public)
User-defined keywords
Estimated Impact75
Family? (F = Feedback message, R = changed R code, M = changed R Module, P = changed Parameters, D = changed Data)
-       [ARIMA Forecasting] [] [2012-12-16 22:00:53] [311e8979fc66fc3b169c8163f1497ef3] [Current]
Feedback Forum

Post a new message
Dataseries X:
1021.3
1039.79
938.12
947.36
956.6
956.6
942.74
951.98
919.63
901.15
887.28
836.45
841.07
836.45
831.83
817.97
771.75
707.05
716.3
725.54
716.3
707.05
716.3
780.99
859.56
961.22
938.12
988.95
910.39
901.15
896.53
910.39
988.95
988.95
965.85
975.09
1002.82
1025.92
1081.38
1164.56
1201.53
1229.26
1275.47
1275.47
1307.82
1252.36
1261.61
1340.17
1414.11
1409.49
1432.59
1520.4
1529.64
1455.7
1427.97
1538.88
1612.82
1635.93
1603.58
1589.72
1557.37
1589.72
1668.28
1635.93
1615.68
1644.69
1622.71
1626.11
1705.55
1841.35
2029.03
2024.21
1952.87
2153.06
2339.29
2502.89
2515.37
2445.68
2491.11
2691.32
2651.8
2593.49
2697.23
2751.63
2713.9
2747.21
2982.32
3063.39
3058.7
3074.38
3341.06
3500.03
392.88
3071.52
2516.41
2350.7
2488.68
2872.65
3220.21
3078.04
3043.98
3134.34
3141.85
3128.01
3241.16
3389.48
3406.36
3449.84
3606.24
3653.99
3607.31
3712.52
3803.47
3806.33
3768.4
3952.06
4134.85
4060.9
3999.88
4004.03
3977.34
3650.08
3708.85
3764.78
3761.86
3802.55
3773.52
3428.7
3194.21
3095.56
3064.85
3022.98
2887.66
3178.86
3438.47
3493.87
3421.89
3390.28
3319.24
3287.84
3222.82
3182.69
3180.21
3116.34
3297.46
3357.48
3386.03
3319.45
3363.59
3303.47
3210.55
3050.27
3010.55
3011.65
3104.98
3087.85
3160.16
3319.22
3432.49
3475.68
3347.48
3388.81
3610.23
3691.45
3587.86
3704.62
3798.75
3956.54
4121.94
4148.56
4100.37
4060.71
4147.86
3926.61
3865.41
3978.57
3851.95
3701.22
3738.65
3766.9
3711.02
3675.22
3560.53
3723.8
3914.27
3870.77
3924.36
3968.89
3982.93
3917.09
3969.18
4149.81
4406.88
423.82
417.72
4527.16
4617.39
4656.23
4579.9
4652.4
4722.95
4845.81
4975.21
5083.64
5378.04
5684.44
5841.87
5857.23
6174.52
6413.17
6780.11
6524.94
6466.7
6495.61
6399.52
6729.98
7060.77
7423.27
8069.17
8650.68
8938.07
9482.08
10225.26
9390.27
8546.11
8073.77
8655.31
9150.1
9775.81
9785.14
9363.44
9304.18
9030.26
8920.8
8606.08
8353.75
8615.63
8128.64
8715.94
8500.8
8142.58
7614.66
7558.95
7820.75
7828.9
7904.59
8140.97
8483.01
8322.68
8268.01
8402.05
8177.78
7950.54
8049.94
7674.13
7666.36
7570.18
7694.45
7810.64
7748.43
7040.64
7077.26
7245.51
7289.12
7486.92
7519.88
7554.84
7780.89
7748.09
7152.25
6484.66
6254.58
5867.32
5544.16
5822.74
5690.63
5564.78
5088.39
4784.22
5332.46
5541.48
5723.92
5736.99
5992.07
6091.43
6158.17
6303.79
6349.71
6802.96
7132.68
7073.29
7264.5
7105.33
7218.71
7225.72
7354.25
7745.46
8070.26
8366.33
8667.51
8854.34
9218.1
9332.9
9358.31
9248.66
9401.2
9652.04
9957.38
10110.63
10169.26
10343.78
10750.21
11337.5
11786.96
12083.04
12007.74
11745.93
11051.51
11445.9
11924.88
12247.63
12690.91
12910.7
13202.12
13654.67
13862.82
13523.93
14211.17
14510.35
14289.23
14111.82
13086.59
13351.54
13747.69
12855.61
12926.93
12121.95
11731.65
11639.51
12163.78
12029.53
11234.18
9852.13
9709.04
9332.75
7108.6
6691.49
6143.05
6379.15
5994.58
5607.94
6046.13
6624.96
6652.54
6696
7315.16
7907.79
8066.35
7939.64
8068.48
8186.33
7975.21
8357.51
8463.38
7937.68
8034.62
8056.61
8176.95
8441.04
8697.39
8665.57
8625.77
8718.42
8822.34
8597.67
8782.05
8661.06
8265.32
8072.58
721.85
7138.6
7351.11
7077
7272.37
7577.84


Summary of computational transaction
Raw Inputview raw input (R code)
Raw Outputview raw output of R engine
Computing time3 seconds
R Server'Gertrude Mary Cox' @ cox.wessa.net

\begin{tabular}{lllllllll}
\hline
Summary of computational transaction \tabularnewline
Raw Input & view raw input (R code)  \tabularnewline
Raw Output & view raw output of R engine  \tabularnewline
Computing time & 3 seconds \tabularnewline
R Server & 'Gertrude Mary Cox' @ cox.wessa.net \tabularnewline
\hline
\end{tabular}
%Source: https://freestatistics.org/blog/index.php?pk=200629&T=0

[TABLE]
[ROW][C]Summary of computational transaction[/C][/ROW]
[ROW][C]Raw Input[/C][C]view raw input (R code) [/C][/ROW]
[ROW][C]Raw Output[/C][C]view raw output of R engine [/C][/ROW]
[ROW][C]Computing time[/C][C]3 seconds[/C][/ROW]
[ROW][C]R Server[/C][C]'Gertrude Mary Cox' @ cox.wessa.net[/C][/ROW]
[/TABLE]
Source: https://freestatistics.org/blog/index.php?pk=200629&T=0

Globally Unique Identifier (entire table): ba.freestatistics.org/blog/index.php?pk=200629&T=0

As an alternative you can also use a QR Code:  

The GUIDs for individual cells are displayed in the table below:

Summary of computational transaction
Raw Inputview raw input (R code)
Raw Outputview raw output of R engine
Computing time3 seconds
R Server'Gertrude Mary Cox' @ cox.wessa.net


Univariate ARIMA Extrapolation Forecast
timeY[t]F[t]95% LB95% UBp-value(H0: Y[t] = F[t])P(F[t]>Y[t-1])P(F[t]>Y[t-s])P(F[t]>Y[361])
3496379.15-------
3505994.58-------
3515607.94-------
3526046.13-------
3536624.96-------
3546652.54-------
3556696-------
3567315.16-------
3577907.79-------
3588066.35-------
3597939.64000000001-------
3608068.48-------
3618186.32999999999-------
3627975.217894.99995152.626112096.94310.48510.4460.81230.446
3638357.517801.09514791.569312700.86710.41190.47220.80980.4388
3648463.387770.33274633.529313030.6870.39810.41340.73970.4384
3657937.687760.20134527.915913299.87680.4750.40180.6560.4401
3668034.627756.85874440.416313550.27390.46260.47560.64570.4422
3678056.617755.75534361.085713792.83610.46110.46390.63460.4444
3688176.957755.39094286.660914030.9880.44760.46250.55470.4465
3698441.047755.27064215.918114265.98440.41820.44950.48170.4484
3708697.397755.23094148.29414498.39540.39210.4210.4640.4501
3718665.577755.21784083.455514728.55590.3990.39560.47930.4518
3728625.777755.21344021.161214956.70860.40640.40220.4660.4533
3738718.427755.2123961.213815183.05170.39970.40920.45470.4547
3748822.347755.21153903.443615407.7560.39230.40260.47750.456
3758597.677755.21143847.700715630.97230.4170.39530.44040.4573
3768782.057755.21133793.851415852.83550.40190.41920.4320.4584
3778661.067755.21133741.775316073.4670.41550.40440.48290.4595
3788265.327755.21133691.363716292.97670.45340.41760.47440.4606
3798072.587755.21133642.517816511.46420.47170.45450.47310.4616
380721.857755.21133595.147916729.02050.06220.47240.46330.4625
3817138.67755.21133549.171816945.72870.44770.93320.44190.4634
3827351.117755.21133504.514417161.6650.46640.55110.42220.4642
38370777755.21133461.106617376.89980.44510.53280.42640.465
3847272.377755.21133418.884717591.49750.46170.55380.43110.4658
3857577.847755.21133377.790117805.51820.48620.53750.42550.4665

\begin{tabular}{lllllllll}
\hline
Univariate ARIMA Extrapolation Forecast \tabularnewline
time & Y[t] & F[t] & 95% LB & 95% UB & p-value(H0: Y[t] = F[t]) & P(F[t]>Y[t-1]) & P(F[t]>Y[t-s]) & P(F[t]>Y[361]) \tabularnewline
349 & 6379.15 & - & - & - & - & - & - & - \tabularnewline
350 & 5994.58 & - & - & - & - & - & - & - \tabularnewline
351 & 5607.94 & - & - & - & - & - & - & - \tabularnewline
352 & 6046.13 & - & - & - & - & - & - & - \tabularnewline
353 & 6624.96 & - & - & - & - & - & - & - \tabularnewline
354 & 6652.54 & - & - & - & - & - & - & - \tabularnewline
355 & 6696 & - & - & - & - & - & - & - \tabularnewline
356 & 7315.16 & - & - & - & - & - & - & - \tabularnewline
357 & 7907.79 & - & - & - & - & - & - & - \tabularnewline
358 & 8066.35 & - & - & - & - & - & - & - \tabularnewline
359 & 7939.64000000001 & - & - & - & - & - & - & - \tabularnewline
360 & 8068.48 & - & - & - & - & - & - & - \tabularnewline
361 & 8186.32999999999 & - & - & - & - & - & - & - \tabularnewline
362 & 7975.21 & 7894.9999 & 5152.6261 & 12096.9431 & 0.4851 & 0.446 & 0.8123 & 0.446 \tabularnewline
363 & 8357.51 & 7801.0951 & 4791.5693 & 12700.8671 & 0.4119 & 0.4722 & 0.8098 & 0.4388 \tabularnewline
364 & 8463.38 & 7770.3327 & 4633.5293 & 13030.687 & 0.3981 & 0.4134 & 0.7397 & 0.4384 \tabularnewline
365 & 7937.68 & 7760.2013 & 4527.9159 & 13299.8768 & 0.475 & 0.4018 & 0.656 & 0.4401 \tabularnewline
366 & 8034.62 & 7756.8587 & 4440.4163 & 13550.2739 & 0.4626 & 0.4756 & 0.6457 & 0.4422 \tabularnewline
367 & 8056.61 & 7755.7553 & 4361.0857 & 13792.8361 & 0.4611 & 0.4639 & 0.6346 & 0.4444 \tabularnewline
368 & 8176.95 & 7755.3909 & 4286.6609 & 14030.988 & 0.4476 & 0.4625 & 0.5547 & 0.4465 \tabularnewline
369 & 8441.04 & 7755.2706 & 4215.9181 & 14265.9844 & 0.4182 & 0.4495 & 0.4817 & 0.4484 \tabularnewline
370 & 8697.39 & 7755.2309 & 4148.294 & 14498.3954 & 0.3921 & 0.421 & 0.464 & 0.4501 \tabularnewline
371 & 8665.57 & 7755.2178 & 4083.4555 & 14728.5559 & 0.399 & 0.3956 & 0.4793 & 0.4518 \tabularnewline
372 & 8625.77 & 7755.2134 & 4021.1612 & 14956.7086 & 0.4064 & 0.4022 & 0.466 & 0.4533 \tabularnewline
373 & 8718.42 & 7755.212 & 3961.2138 & 15183.0517 & 0.3997 & 0.4092 & 0.4547 & 0.4547 \tabularnewline
374 & 8822.34 & 7755.2115 & 3903.4436 & 15407.756 & 0.3923 & 0.4026 & 0.4775 & 0.456 \tabularnewline
375 & 8597.67 & 7755.2114 & 3847.7007 & 15630.9723 & 0.417 & 0.3953 & 0.4404 & 0.4573 \tabularnewline
376 & 8782.05 & 7755.2113 & 3793.8514 & 15852.8355 & 0.4019 & 0.4192 & 0.432 & 0.4584 \tabularnewline
377 & 8661.06 & 7755.2113 & 3741.7753 & 16073.467 & 0.4155 & 0.4044 & 0.4829 & 0.4595 \tabularnewline
378 & 8265.32 & 7755.2113 & 3691.3637 & 16292.9767 & 0.4534 & 0.4176 & 0.4744 & 0.4606 \tabularnewline
379 & 8072.58 & 7755.2113 & 3642.5178 & 16511.4642 & 0.4717 & 0.4545 & 0.4731 & 0.4616 \tabularnewline
380 & 721.85 & 7755.2113 & 3595.1479 & 16729.0205 & 0.0622 & 0.4724 & 0.4633 & 0.4625 \tabularnewline
381 & 7138.6 & 7755.2113 & 3549.1718 & 16945.7287 & 0.4477 & 0.9332 & 0.4419 & 0.4634 \tabularnewline
382 & 7351.11 & 7755.2113 & 3504.5144 & 17161.665 & 0.4664 & 0.5511 & 0.4222 & 0.4642 \tabularnewline
383 & 7077 & 7755.2113 & 3461.1066 & 17376.8998 & 0.4451 & 0.5328 & 0.4264 & 0.465 \tabularnewline
384 & 7272.37 & 7755.2113 & 3418.8847 & 17591.4975 & 0.4617 & 0.5538 & 0.4311 & 0.4658 \tabularnewline
385 & 7577.84 & 7755.2113 & 3377.7901 & 17805.5182 & 0.4862 & 0.5375 & 0.4255 & 0.4665 \tabularnewline
\hline
\end{tabular}
%Source: https://freestatistics.org/blog/index.php?pk=200629&T=1

[TABLE]
[ROW][C]Univariate ARIMA Extrapolation Forecast[/C][/ROW]
[ROW][C]time[/C][C]Y[t][/C][C]F[t][/C][C]95% LB[/C][C]95% UB[/C][C]p-value(H0: Y[t] = F[t])[/C][C]P(F[t]>Y[t-1])[/C][C]P(F[t]>Y[t-s])[/C][C]P(F[t]>Y[361])[/C][/ROW]
[ROW][C]349[/C][C]6379.15[/C][C]-[/C][C]-[/C][C]-[/C][C]-[/C][C]-[/C][C]-[/C][C]-[/C][/ROW]
[ROW][C]350[/C][C]5994.58[/C][C]-[/C][C]-[/C][C]-[/C][C]-[/C][C]-[/C][C]-[/C][C]-[/C][/ROW]
[ROW][C]351[/C][C]5607.94[/C][C]-[/C][C]-[/C][C]-[/C][C]-[/C][C]-[/C][C]-[/C][C]-[/C][/ROW]
[ROW][C]352[/C][C]6046.13[/C][C]-[/C][C]-[/C][C]-[/C][C]-[/C][C]-[/C][C]-[/C][C]-[/C][/ROW]
[ROW][C]353[/C][C]6624.96[/C][C]-[/C][C]-[/C][C]-[/C][C]-[/C][C]-[/C][C]-[/C][C]-[/C][/ROW]
[ROW][C]354[/C][C]6652.54[/C][C]-[/C][C]-[/C][C]-[/C][C]-[/C][C]-[/C][C]-[/C][C]-[/C][/ROW]
[ROW][C]355[/C][C]6696[/C][C]-[/C][C]-[/C][C]-[/C][C]-[/C][C]-[/C][C]-[/C][C]-[/C][/ROW]
[ROW][C]356[/C][C]7315.16[/C][C]-[/C][C]-[/C][C]-[/C][C]-[/C][C]-[/C][C]-[/C][C]-[/C][/ROW]
[ROW][C]357[/C][C]7907.79[/C][C]-[/C][C]-[/C][C]-[/C][C]-[/C][C]-[/C][C]-[/C][C]-[/C][/ROW]
[ROW][C]358[/C][C]8066.35[/C][C]-[/C][C]-[/C][C]-[/C][C]-[/C][C]-[/C][C]-[/C][C]-[/C][/ROW]
[ROW][C]359[/C][C]7939.64000000001[/C][C]-[/C][C]-[/C][C]-[/C][C]-[/C][C]-[/C][C]-[/C][C]-[/C][/ROW]
[ROW][C]360[/C][C]8068.48[/C][C]-[/C][C]-[/C][C]-[/C][C]-[/C][C]-[/C][C]-[/C][C]-[/C][/ROW]
[ROW][C]361[/C][C]8186.32999999999[/C][C]-[/C][C]-[/C][C]-[/C][C]-[/C][C]-[/C][C]-[/C][C]-[/C][/ROW]
[ROW][C]362[/C][C]7975.21[/C][C]7894.9999[/C][C]5152.6261[/C][C]12096.9431[/C][C]0.4851[/C][C]0.446[/C][C]0.8123[/C][C]0.446[/C][/ROW]
[ROW][C]363[/C][C]8357.51[/C][C]7801.0951[/C][C]4791.5693[/C][C]12700.8671[/C][C]0.4119[/C][C]0.4722[/C][C]0.8098[/C][C]0.4388[/C][/ROW]
[ROW][C]364[/C][C]8463.38[/C][C]7770.3327[/C][C]4633.5293[/C][C]13030.687[/C][C]0.3981[/C][C]0.4134[/C][C]0.7397[/C][C]0.4384[/C][/ROW]
[ROW][C]365[/C][C]7937.68[/C][C]7760.2013[/C][C]4527.9159[/C][C]13299.8768[/C][C]0.475[/C][C]0.4018[/C][C]0.656[/C][C]0.4401[/C][/ROW]
[ROW][C]366[/C][C]8034.62[/C][C]7756.8587[/C][C]4440.4163[/C][C]13550.2739[/C][C]0.4626[/C][C]0.4756[/C][C]0.6457[/C][C]0.4422[/C][/ROW]
[ROW][C]367[/C][C]8056.61[/C][C]7755.7553[/C][C]4361.0857[/C][C]13792.8361[/C][C]0.4611[/C][C]0.4639[/C][C]0.6346[/C][C]0.4444[/C][/ROW]
[ROW][C]368[/C][C]8176.95[/C][C]7755.3909[/C][C]4286.6609[/C][C]14030.988[/C][C]0.4476[/C][C]0.4625[/C][C]0.5547[/C][C]0.4465[/C][/ROW]
[ROW][C]369[/C][C]8441.04[/C][C]7755.2706[/C][C]4215.9181[/C][C]14265.9844[/C][C]0.4182[/C][C]0.4495[/C][C]0.4817[/C][C]0.4484[/C][/ROW]
[ROW][C]370[/C][C]8697.39[/C][C]7755.2309[/C][C]4148.294[/C][C]14498.3954[/C][C]0.3921[/C][C]0.421[/C][C]0.464[/C][C]0.4501[/C][/ROW]
[ROW][C]371[/C][C]8665.57[/C][C]7755.2178[/C][C]4083.4555[/C][C]14728.5559[/C][C]0.399[/C][C]0.3956[/C][C]0.4793[/C][C]0.4518[/C][/ROW]
[ROW][C]372[/C][C]8625.77[/C][C]7755.2134[/C][C]4021.1612[/C][C]14956.7086[/C][C]0.4064[/C][C]0.4022[/C][C]0.466[/C][C]0.4533[/C][/ROW]
[ROW][C]373[/C][C]8718.42[/C][C]7755.212[/C][C]3961.2138[/C][C]15183.0517[/C][C]0.3997[/C][C]0.4092[/C][C]0.4547[/C][C]0.4547[/C][/ROW]
[ROW][C]374[/C][C]8822.34[/C][C]7755.2115[/C][C]3903.4436[/C][C]15407.756[/C][C]0.3923[/C][C]0.4026[/C][C]0.4775[/C][C]0.456[/C][/ROW]
[ROW][C]375[/C][C]8597.67[/C][C]7755.2114[/C][C]3847.7007[/C][C]15630.9723[/C][C]0.417[/C][C]0.3953[/C][C]0.4404[/C][C]0.4573[/C][/ROW]
[ROW][C]376[/C][C]8782.05[/C][C]7755.2113[/C][C]3793.8514[/C][C]15852.8355[/C][C]0.4019[/C][C]0.4192[/C][C]0.432[/C][C]0.4584[/C][/ROW]
[ROW][C]377[/C][C]8661.06[/C][C]7755.2113[/C][C]3741.7753[/C][C]16073.467[/C][C]0.4155[/C][C]0.4044[/C][C]0.4829[/C][C]0.4595[/C][/ROW]
[ROW][C]378[/C][C]8265.32[/C][C]7755.2113[/C][C]3691.3637[/C][C]16292.9767[/C][C]0.4534[/C][C]0.4176[/C][C]0.4744[/C][C]0.4606[/C][/ROW]
[ROW][C]379[/C][C]8072.58[/C][C]7755.2113[/C][C]3642.5178[/C][C]16511.4642[/C][C]0.4717[/C][C]0.4545[/C][C]0.4731[/C][C]0.4616[/C][/ROW]
[ROW][C]380[/C][C]721.85[/C][C]7755.2113[/C][C]3595.1479[/C][C]16729.0205[/C][C]0.0622[/C][C]0.4724[/C][C]0.4633[/C][C]0.4625[/C][/ROW]
[ROW][C]381[/C][C]7138.6[/C][C]7755.2113[/C][C]3549.1718[/C][C]16945.7287[/C][C]0.4477[/C][C]0.9332[/C][C]0.4419[/C][C]0.4634[/C][/ROW]
[ROW][C]382[/C][C]7351.11[/C][C]7755.2113[/C][C]3504.5144[/C][C]17161.665[/C][C]0.4664[/C][C]0.5511[/C][C]0.4222[/C][C]0.4642[/C][/ROW]
[ROW][C]383[/C][C]7077[/C][C]7755.2113[/C][C]3461.1066[/C][C]17376.8998[/C][C]0.4451[/C][C]0.5328[/C][C]0.4264[/C][C]0.465[/C][/ROW]
[ROW][C]384[/C][C]7272.37[/C][C]7755.2113[/C][C]3418.8847[/C][C]17591.4975[/C][C]0.4617[/C][C]0.5538[/C][C]0.4311[/C][C]0.4658[/C][/ROW]
[ROW][C]385[/C][C]7577.84[/C][C]7755.2113[/C][C]3377.7901[/C][C]17805.5182[/C][C]0.4862[/C][C]0.5375[/C][C]0.4255[/C][C]0.4665[/C][/ROW]
[/TABLE]
Source: https://freestatistics.org/blog/index.php?pk=200629&T=1

Globally Unique Identifier (entire table): ba.freestatistics.org/blog/index.php?pk=200629&T=1

As an alternative you can also use a QR Code:  

The GUIDs for individual cells are displayed in the table below:

Univariate ARIMA Extrapolation Forecast
timeY[t]F[t]95% LB95% UBp-value(H0: Y[t] = F[t])P(F[t]>Y[t-1])P(F[t]>Y[t-s])P(F[t]>Y[361])
3496379.15-------
3505994.58-------
3515607.94-------
3526046.13-------
3536624.96-------
3546652.54-------
3556696-------
3567315.16-------
3577907.79-------
3588066.35-------
3597939.64000000001-------
3608068.48-------
3618186.32999999999-------
3627975.217894.99995152.626112096.94310.48510.4460.81230.446
3638357.517801.09514791.569312700.86710.41190.47220.80980.4388
3648463.387770.33274633.529313030.6870.39810.41340.73970.4384
3657937.687760.20134527.915913299.87680.4750.40180.6560.4401
3668034.627756.85874440.416313550.27390.46260.47560.64570.4422
3678056.617755.75534361.085713792.83610.46110.46390.63460.4444
3688176.957755.39094286.660914030.9880.44760.46250.55470.4465
3698441.047755.27064215.918114265.98440.41820.44950.48170.4484
3708697.397755.23094148.29414498.39540.39210.4210.4640.4501
3718665.577755.21784083.455514728.55590.3990.39560.47930.4518
3728625.777755.21344021.161214956.70860.40640.40220.4660.4533
3738718.427755.2123961.213815183.05170.39970.40920.45470.4547
3748822.347755.21153903.443615407.7560.39230.40260.47750.456
3758597.677755.21143847.700715630.97230.4170.39530.44040.4573
3768782.057755.21133793.851415852.83550.40190.41920.4320.4584
3778661.067755.21133741.775316073.4670.41550.40440.48290.4595
3788265.327755.21133691.363716292.97670.45340.41760.47440.4606
3798072.587755.21133642.517816511.46420.47170.45450.47310.4616
380721.857755.21133595.147916729.02050.06220.47240.46330.4625
3817138.67755.21133549.171816945.72870.44770.93320.44190.4634
3827351.117755.21133504.514417161.6650.46640.55110.42220.4642
38370777755.21133461.106617376.89980.44510.53280.42640.465
3847272.377755.21133418.884717591.49750.46170.55380.43110.4658
3857577.847755.21133377.790117805.51820.48620.53750.42550.4665


Univariate ARIMA Extrapolation Forecast Performance
time% S.E.PEMAPESq.EMSERMSE
3620.27150.010206433.652200
3630.32050.07130.0407309597.5477158015.6397.5118
3640.34540.08920.0569480314.5723265448.5907515.217
3650.36420.02290.048431498.6922206961.1161454.9298
3660.38110.03580.045977151.3404180999.161425.44
3670.39710.03880.044790513.5768165918.2303407.3306
3680.41290.05440.0461177712.0557167603.0625409.3935
3690.42830.08840.0514470279.6431205437.6351453.2523
3700.44360.12150.0592887663.7797281240.54530.3212
3710.45880.11740.065828741.1696335990.603579.647
3720.47380.11230.0693757868.7143374343.1586611.8359
3730.48870.12420.0739927769.6218420462.0305648.4304
3740.50340.13760.07881138763.1437475715.9623689.7217
3750.51810.10860.0809709736.5145492431.716701.7348
3760.53270.13240.08431054397.6428529896.1111727.9396
3770.54720.11680.0864820561.8337548062.7188740.3126
3780.56170.06580.0851260210.8726531130.2572728.7868
3790.57610.04090.0827100722.8847507218.7366712.1929
3800.5904-0.90690.126149468171.32353084110.9781756.1637
3810.6046-0.07950.1237380209.50792948915.90451717.2408
3820.6188-0.05210.1203163297.86892816267.42661678.1738
3830.633-0.08750.1188459970.58122709163.02451645.9535
3840.6471-0.06230.1164233135.73082601509.66391612.9196
3850.6612-0.02290.112531460.58172494424.28551579.3747

\begin{tabular}{lllllllll}
\hline
Univariate ARIMA Extrapolation Forecast Performance \tabularnewline
time & % S.E. & PE & MAPE & Sq.E & MSE & RMSE \tabularnewline
362 & 0.2715 & 0.0102 & 0 & 6433.6522 & 0 & 0 \tabularnewline
363 & 0.3205 & 0.0713 & 0.0407 & 309597.5477 & 158015.6 & 397.5118 \tabularnewline
364 & 0.3454 & 0.0892 & 0.0569 & 480314.5723 & 265448.5907 & 515.217 \tabularnewline
365 & 0.3642 & 0.0229 & 0.0484 & 31498.6922 & 206961.1161 & 454.9298 \tabularnewline
366 & 0.3811 & 0.0358 & 0.0459 & 77151.3404 & 180999.161 & 425.44 \tabularnewline
367 & 0.3971 & 0.0388 & 0.0447 & 90513.5768 & 165918.2303 & 407.3306 \tabularnewline
368 & 0.4129 & 0.0544 & 0.0461 & 177712.0557 & 167603.0625 & 409.3935 \tabularnewline
369 & 0.4283 & 0.0884 & 0.0514 & 470279.6431 & 205437.6351 & 453.2523 \tabularnewline
370 & 0.4436 & 0.1215 & 0.0592 & 887663.7797 & 281240.54 & 530.3212 \tabularnewline
371 & 0.4588 & 0.1174 & 0.065 & 828741.1696 & 335990.603 & 579.647 \tabularnewline
372 & 0.4738 & 0.1123 & 0.0693 & 757868.7143 & 374343.1586 & 611.8359 \tabularnewline
373 & 0.4887 & 0.1242 & 0.0739 & 927769.6218 & 420462.0305 & 648.4304 \tabularnewline
374 & 0.5034 & 0.1376 & 0.0788 & 1138763.1437 & 475715.9623 & 689.7217 \tabularnewline
375 & 0.5181 & 0.1086 & 0.0809 & 709736.5145 & 492431.716 & 701.7348 \tabularnewline
376 & 0.5327 & 0.1324 & 0.0843 & 1054397.6428 & 529896.1111 & 727.9396 \tabularnewline
377 & 0.5472 & 0.1168 & 0.0864 & 820561.8337 & 548062.7188 & 740.3126 \tabularnewline
378 & 0.5617 & 0.0658 & 0.0851 & 260210.8726 & 531130.2572 & 728.7868 \tabularnewline
379 & 0.5761 & 0.0409 & 0.0827 & 100722.8847 & 507218.7366 & 712.1929 \tabularnewline
380 & 0.5904 & -0.9069 & 0.1261 & 49468171.3235 & 3084110.978 & 1756.1637 \tabularnewline
381 & 0.6046 & -0.0795 & 0.1237 & 380209.5079 & 2948915.9045 & 1717.2408 \tabularnewline
382 & 0.6188 & -0.0521 & 0.1203 & 163297.8689 & 2816267.4266 & 1678.1738 \tabularnewline
383 & 0.633 & -0.0875 & 0.1188 & 459970.5812 & 2709163.0245 & 1645.9535 \tabularnewline
384 & 0.6471 & -0.0623 & 0.1164 & 233135.7308 & 2601509.6639 & 1612.9196 \tabularnewline
385 & 0.6612 & -0.0229 & 0.1125 & 31460.5817 & 2494424.2855 & 1579.3747 \tabularnewline
\hline
\end{tabular}
%Source: https://freestatistics.org/blog/index.php?pk=200629&T=2

[TABLE]
[ROW][C]Univariate ARIMA Extrapolation Forecast Performance[/C][/ROW]
[ROW][C]time[/C][C]% S.E.[/C][C]PE[/C][C]MAPE[/C][C]Sq.E[/C][C]MSE[/C][C]RMSE[/C][/ROW]
[ROW][C]362[/C][C]0.2715[/C][C]0.0102[/C][C]0[/C][C]6433.6522[/C][C]0[/C][C]0[/C][/ROW]
[ROW][C]363[/C][C]0.3205[/C][C]0.0713[/C][C]0.0407[/C][C]309597.5477[/C][C]158015.6[/C][C]397.5118[/C][/ROW]
[ROW][C]364[/C][C]0.3454[/C][C]0.0892[/C][C]0.0569[/C][C]480314.5723[/C][C]265448.5907[/C][C]515.217[/C][/ROW]
[ROW][C]365[/C][C]0.3642[/C][C]0.0229[/C][C]0.0484[/C][C]31498.6922[/C][C]206961.1161[/C][C]454.9298[/C][/ROW]
[ROW][C]366[/C][C]0.3811[/C][C]0.0358[/C][C]0.0459[/C][C]77151.3404[/C][C]180999.161[/C][C]425.44[/C][/ROW]
[ROW][C]367[/C][C]0.3971[/C][C]0.0388[/C][C]0.0447[/C][C]90513.5768[/C][C]165918.2303[/C][C]407.3306[/C][/ROW]
[ROW][C]368[/C][C]0.4129[/C][C]0.0544[/C][C]0.0461[/C][C]177712.0557[/C][C]167603.0625[/C][C]409.3935[/C][/ROW]
[ROW][C]369[/C][C]0.4283[/C][C]0.0884[/C][C]0.0514[/C][C]470279.6431[/C][C]205437.6351[/C][C]453.2523[/C][/ROW]
[ROW][C]370[/C][C]0.4436[/C][C]0.1215[/C][C]0.0592[/C][C]887663.7797[/C][C]281240.54[/C][C]530.3212[/C][/ROW]
[ROW][C]371[/C][C]0.4588[/C][C]0.1174[/C][C]0.065[/C][C]828741.1696[/C][C]335990.603[/C][C]579.647[/C][/ROW]
[ROW][C]372[/C][C]0.4738[/C][C]0.1123[/C][C]0.0693[/C][C]757868.7143[/C][C]374343.1586[/C][C]611.8359[/C][/ROW]
[ROW][C]373[/C][C]0.4887[/C][C]0.1242[/C][C]0.0739[/C][C]927769.6218[/C][C]420462.0305[/C][C]648.4304[/C][/ROW]
[ROW][C]374[/C][C]0.5034[/C][C]0.1376[/C][C]0.0788[/C][C]1138763.1437[/C][C]475715.9623[/C][C]689.7217[/C][/ROW]
[ROW][C]375[/C][C]0.5181[/C][C]0.1086[/C][C]0.0809[/C][C]709736.5145[/C][C]492431.716[/C][C]701.7348[/C][/ROW]
[ROW][C]376[/C][C]0.5327[/C][C]0.1324[/C][C]0.0843[/C][C]1054397.6428[/C][C]529896.1111[/C][C]727.9396[/C][/ROW]
[ROW][C]377[/C][C]0.5472[/C][C]0.1168[/C][C]0.0864[/C][C]820561.8337[/C][C]548062.7188[/C][C]740.3126[/C][/ROW]
[ROW][C]378[/C][C]0.5617[/C][C]0.0658[/C][C]0.0851[/C][C]260210.8726[/C][C]531130.2572[/C][C]728.7868[/C][/ROW]
[ROW][C]379[/C][C]0.5761[/C][C]0.0409[/C][C]0.0827[/C][C]100722.8847[/C][C]507218.7366[/C][C]712.1929[/C][/ROW]
[ROW][C]380[/C][C]0.5904[/C][C]-0.9069[/C][C]0.1261[/C][C]49468171.3235[/C][C]3084110.978[/C][C]1756.1637[/C][/ROW]
[ROW][C]381[/C][C]0.6046[/C][C]-0.0795[/C][C]0.1237[/C][C]380209.5079[/C][C]2948915.9045[/C][C]1717.2408[/C][/ROW]
[ROW][C]382[/C][C]0.6188[/C][C]-0.0521[/C][C]0.1203[/C][C]163297.8689[/C][C]2816267.4266[/C][C]1678.1738[/C][/ROW]
[ROW][C]383[/C][C]0.633[/C][C]-0.0875[/C][C]0.1188[/C][C]459970.5812[/C][C]2709163.0245[/C][C]1645.9535[/C][/ROW]
[ROW][C]384[/C][C]0.6471[/C][C]-0.0623[/C][C]0.1164[/C][C]233135.7308[/C][C]2601509.6639[/C][C]1612.9196[/C][/ROW]
[ROW][C]385[/C][C]0.6612[/C][C]-0.0229[/C][C]0.1125[/C][C]31460.5817[/C][C]2494424.2855[/C][C]1579.3747[/C][/ROW]
[/TABLE]
Source: https://freestatistics.org/blog/index.php?pk=200629&T=2

Globally Unique Identifier (entire table): ba.freestatistics.org/blog/index.php?pk=200629&T=2

As an alternative you can also use a QR Code:  

The GUIDs for individual cells are displayed in the table below:

Univariate ARIMA Extrapolation Forecast Performance
time% S.E.PEMAPESq.EMSERMSE
3620.27150.010206433.652200
3630.32050.07130.0407309597.5477158015.6397.5118
3640.34540.08920.0569480314.5723265448.5907515.217
3650.36420.02290.048431498.6922206961.1161454.9298
3660.38110.03580.045977151.3404180999.161425.44
3670.39710.03880.044790513.5768165918.2303407.3306
3680.41290.05440.0461177712.0557167603.0625409.3935
3690.42830.08840.0514470279.6431205437.6351453.2523
3700.44360.12150.0592887663.7797281240.54530.3212
3710.45880.11740.065828741.1696335990.603579.647
3720.47380.11230.0693757868.7143374343.1586611.8359
3730.48870.12420.0739927769.6218420462.0305648.4304
3740.50340.13760.07881138763.1437475715.9623689.7217
3750.51810.10860.0809709736.5145492431.716701.7348
3760.53270.13240.08431054397.6428529896.1111727.9396
3770.54720.11680.0864820561.8337548062.7188740.3126
3780.56170.06580.0851260210.8726531130.2572728.7868
3790.57610.04090.0827100722.8847507218.7366712.1929
3800.5904-0.90690.126149468171.32353084110.9781756.1637
3810.6046-0.07950.1237380209.50792948915.90451717.2408
3820.6188-0.05210.1203163297.86892816267.42661678.1738
3830.633-0.08750.1188459970.58122709163.02451645.9535
3840.6471-0.06230.1164233135.73082601509.66391612.9196
3850.6612-0.02290.112531460.58172494424.28551579.3747


Parameters (Session):
par1 = 12 ; par2 = 0.0 ; par3 = 1 ; par4 = 0 ; par5 = 12 ; par6 = 1 ; par7 = 1 ; par8 = 0 ; par9 = 0 ; par10 = FALSE ;
Parameters (R input):
par1 = 24 ; par2 = 0.0 ; par3 = 1 ; par4 = 0 ; par5 = 12 ; par6 = 1 ; par7 = 1 ; par8 = 0 ; par9 = 0 ; par10 = FALSE ;
R code (references can be found in the software module):
par1 <- as.numeric(par1) #cut off periods
par2 <- as.numeric(par2) #lambda
par3 <- as.numeric(par3) #degree of non-seasonal differencing
par4 <- as.numeric(par4) #degree of seasonal differencing
par5 <- as.numeric(par5) #seasonal period
par6 <- as.numeric(par6) #p
par7 <- as.numeric(par7) #q
par8 <- as.numeric(par8) #P
par9 <- as.numeric(par9) #Q
if (par10 == 'TRUE') par10 <- TRUE
if (par10 == 'FALSE') par10 <- FALSE
if (par2 == 0) x <- log(x)
if (par2 != 0) x <- x^par2
lx <- length(x)
first <- lx - 2*par1
nx <- lx - par1
nx1 <- nx + 1
fx <- lx - nx
if (fx < 1) {
fx <- par5
nx1 <- lx + fx - 1
first <- lx - 2*fx
}
first <- 1
if (fx < 3) fx <- round(lx/10,0)
(arima.out <- arima(x[1:nx], order=c(par6,par3,par7), seasonal=list(order=c(par8,par4,par9), period=par5), include.mean=par10, method='ML'))
(forecast <- predict(arima.out,par1))
(lb <- forecast$pred - 1.96 * forecast$se)
(ub <- forecast$pred + 1.96 * forecast$se)
if (par2 == 0) {
x <- exp(x)
forecast$pred <- exp(forecast$pred)
lb <- exp(lb)
ub <- exp(ub)
}
if (par2 != 0) {
x <- x^(1/par2)
forecast$pred <- forecast$pred^(1/par2)
lb <- lb^(1/par2)
ub <- ub^(1/par2)
}
if (par2 < 0) {
olb <- lb
lb <- ub
ub <- olb
}
(actandfor <- c(x[1:nx], forecast$pred))
(perc.se <- (ub-forecast$pred)/1.96/forecast$pred)
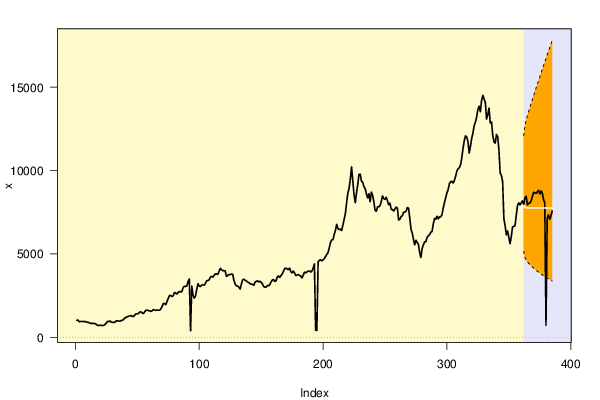
bitmap(file='test1.png')
opar <- par(mar=c(4,4,2,2),las=1)
ylim <- c( min(x[first:nx],lb), max(x[first:nx],ub))
plot(x,ylim=ylim,type='n',xlim=c(first,lx))
usr <- par('usr')
rect(usr[1],usr[3],nx+1,usr[4],border=NA,col='lemonchiffon')
rect(nx1,usr[3],usr[2],usr[4],border=NA,col='lavender')
abline(h= (-3:3)*2 , col ='gray', lty =3)
polygon( c(nx1:lx,lx:nx1), c(lb,rev(ub)), col = 'orange', lty=2,border=NA)
lines(nx1:lx, lb , lty=2)
lines(nx1:lx, ub , lty=2)
lines(x, lwd=2)
lines(nx1:lx, forecast$pred , lwd=2 , col ='white')
box()
par(opar)
dev.off()
prob.dec <- array(NA, dim=fx)
prob.sdec <- array(NA, dim=fx)
prob.ldec <- array(NA, dim=fx)
prob.pval <- array(NA, dim=fx)
perf.pe <- array(0, dim=fx)
perf.mape <- array(0, dim=fx)
perf.mape1 <- array(0, dim=fx)
perf.se <- array(0, dim=fx)
perf.mse <- array(0, dim=fx)
perf.mse1 <- array(0, dim=fx)
perf.rmse <- array(0, dim=fx)
for (i in 1:fx) {
locSD <- (ub[i] - forecast$pred[i]) / 1.96
perf.pe[i] = (x[nx+i] - forecast$pred[i]) / forecast$pred[i]
perf.se[i] = (x[nx+i] - forecast$pred[i])^2
prob.dec[i] = pnorm((x[nx+i-1] - forecast$pred[i]) / locSD)
prob.sdec[i] = pnorm((x[nx+i-par5] - forecast$pred[i]) / locSD)
prob.ldec[i] = pnorm((x[nx] - forecast$pred[i]) / locSD)
prob.pval[i] = pnorm(abs(x[nx+i] - forecast$pred[i]) / locSD)
}
perf.mape[1] = abs(perf.pe[1])
perf.mse[1] = abs(perf.se[1])
for (i in 2:fx) {
perf.mape[i] = perf.mape[i-1] + abs(perf.pe[i])
perf.mape1[i] = perf.mape[i] / i
perf.mse[i] = perf.mse[i-1] + perf.se[i]
perf.mse1[i] = perf.mse[i] / i
}
perf.rmse = sqrt(perf.mse1)
bitmap(file='test2.png')
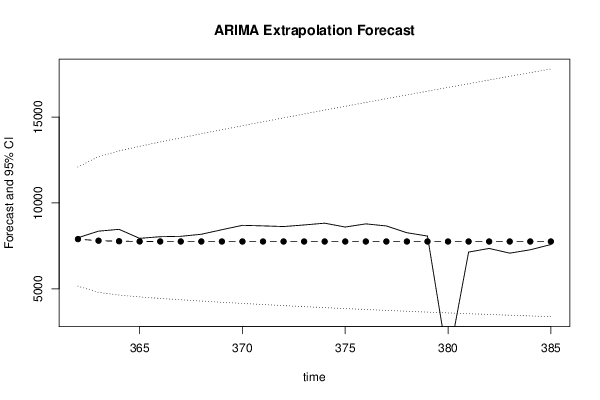
plot(forecast$pred, pch=19, type='b',main='ARIMA Extrapolation Forecast', ylab='Forecast and 95% CI', xlab='time',ylim=c(min(lb),max(ub)))
dum <- forecast$pred
dum[1:par1] <- x[(nx+1):lx]
lines(dum, lty=1)
lines(ub,lty=3)
lines(lb,lty=3)
dev.off()
load(file='createtable')
a<-table.start()
a<-table.row.start(a)
a<-table.element(a,'Univariate ARIMA Extrapolation Forecast',9,TRUE)
a<-table.row.end(a)
a<-table.row.start(a)
a<-table.element(a,'time',1,header=TRUE)
a<-table.element(a,'Y[t]',1,header=TRUE)
a<-table.element(a,'F[t]',1,header=TRUE)
a<-table.element(a,'95% LB',1,header=TRUE)
a<-table.element(a,'95% UB',1,header=TRUE)
a<-table.element(a,'p-value
(H0: Y[t] = F[t])',1,header=TRUE)
a<-table.element(a,'P(F[t]>Y[t-1])',1,header=TRUE)
a<-table.element(a,'P(F[t]>Y[t-s])',1,header=TRUE)
mylab <- paste('P(F[t]>Y[',nx,sep='')
mylab <- paste(mylab,'])',sep='')
a<-table.element(a,mylab,1,header=TRUE)
a<-table.row.end(a)
for (i in (nx-par5):nx) {
a<-table.row.start(a)
a<-table.element(a,i,header=TRUE)
a<-table.element(a,x[i])
a<-table.element(a,'-')
a<-table.row.end(a)
}
for (i in 1:fx) {
a<-table.row.start(a)
a<-table.element(a,nx+i,header=TRUE)
a<-table.element(a,round(x[nx+i],4))
a<-table.element(a,round(forecast$pred[i],4))
a<-table.element(a,round(lb[i],4))
a<-table.element(a,round(ub[i],4))
a<-table.element(a,round((1-prob.pval[i]),4))
a<-table.element(a,round((1-prob.dec[i]),4))
a<-table.element(a,round((1-prob.sdec[i]),4))
a<-table.element(a,round((1-prob.ldec[i]),4))
a<-table.row.end(a)
}
a<-table.end(a)
table.save(a,file='mytable.tab')
a<-table.start()
a<-table.row.start(a)
a<-table.element(a,'Univariate ARIMA Extrapolation Forecast Performance',7,TRUE)
a<-table.row.end(a)
a<-table.row.start(a)
a<-table.element(a,'time',1,header=TRUE)
a<-table.element(a,'% S.E.',1,header=TRUE)
a<-table.element(a,'PE',1,header=TRUE)
a<-table.element(a,'MAPE',1,header=TRUE)
a<-table.element(a,'Sq.E',1,header=TRUE)
a<-table.element(a,'MSE',1,header=TRUE)
a<-table.element(a,'RMSE',1,header=TRUE)
a<-table.row.end(a)
for (i in 1:fx) {
a<-table.row.start(a)
a<-table.element(a,nx+i,header=TRUE)
a<-table.element(a,round(perc.se[i],4))
a<-table.element(a,round(perf.pe[i],4))
a<-table.element(a,round(perf.mape1[i],4))
a<-table.element(a,round(perf.se[i],4))
a<-table.element(a,round(perf.mse1[i],4))
a<-table.element(a,round(perf.rmse[i],4))
a<-table.row.end(a)
}
a<-table.end(a)
table.save(a,file='mytable1.tab')