| Tabulation of Results | ||
| Used x CorrectAnalysis | ||
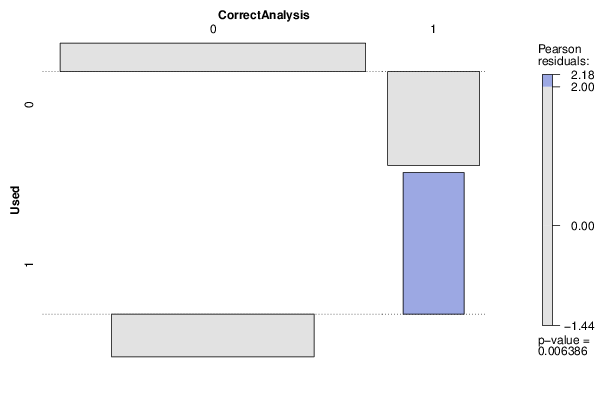
| 0 | 1 | 0 | 25 | 0 | 1 | 8 | 3 |
| Tabulation of Expected Results | ||
| Used x CorrectAnalysis | ||
| 0 | 1 | 0 | 22.92 | 2.08 | 1 | 10.08 | 0.92 |
| Statistical Results | |
| Pearson's Chi-squared test with simulated p-value (based on 2000 replicates) | |
| Exact Pearson Chi Square Statistic | 7.44 |
| P value | 0.02 |