| Tabulation of Results | ||
| T20 x CorrectAN | ||
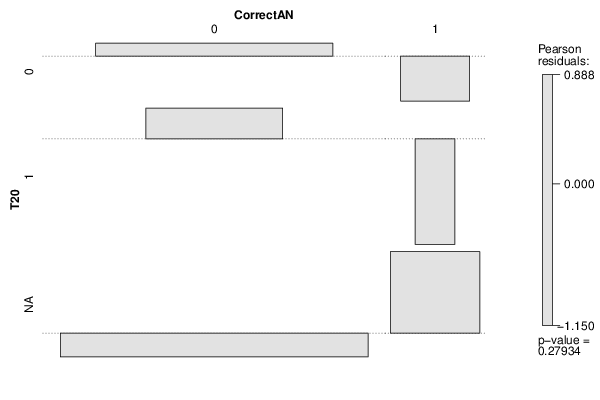
| 0 | 1 | 0 | 48 | 3 | 1 | 17 | 0 | NA | 77 | 9 |
| Tabulation of Expected Results | ||
| T20 x CorrectAN | ||
| 0 | 1 | 0 | 47.03 | 3.97 | 1 | 15.68 | 1.32 | NA | 79.3 | 6.7 |
| Statistical Results | |
| Pearson's Chi-squared test | |
| Pearson Chi Square Statistic | 2.55 |
| Degrees of Freedom | 2 |
| P value | 0.28 |